- PE 150
- Posts
- The Sharpening Cycle
The Sharpening Cycle
Discipline, Dry Powder, and the New Rules of Buyouts
Private equity is not in retreat. It is in recalibration.
After the rate shock and liquidity freeze that followed the 2021 peak, many expected a broad reset across deal pricing, capital deployment, and platform strategy. Instead, what we see is something more nuanced. Multiples remain elevated. Dry powder remains abundant. Acquisition appetite is resilient. And yet behavior across the industry has clearly shifted. Sponsors are not pulling back. They are tightening standards.
This report captures a market that is fragmenting at the edges while becoming more disciplined at the core. Platform size preference is splitting between sub $100 million entry points and $500 million plus institutional scale assets, squeezing the traditional middle. Incremental capital is flowing opportunistically rather than aggressively. Underwriting has moved away from financial engineering toward management quality and sector defensibility. Sponsors are maintaining entry sizes, but only with sharper selectivity and a higher conviction bar.
At the same time, structural forces are building beneath the surface. More than half of global buyout dry powder is less than two years old, but the two to three year vintage bucket is swelling. That means the industry still has time, but not unlimited time. Valuation gaps remain the single largest obstacle to renewed deal velocity, more than rates or spreads. Exit expectations are rising and beginning to converge with acquisition optimism, suggesting the liquidity cycle may finally be turning.
Overlay this with persistent US pricing premiums and more conservative structuring in Europe, and a clear pattern emerges. This is not a euphoric expansion phase. Nor is it a contraction. It is a sharpening cycle. Capital is available. Competition is intense. But margin for error has narrowed.
In this environment, returns will not be driven by access to leverage or multiple expansion. They will be driven by sourcing edge, operational rigor, sector selection, and capital structure discipline.
Private equity is not shrinking. It is becoming more exacting.
Platform Size Preference Is Fragmenting Toward the Extremes
Private equity’s center of gravity is shifting. While mid market platforms have historically dominated sponsor attention, current preferences suggest a barbell effect is forming across enterprise value ranges. The data shows firms recalibrating not just based on opportunity, but on capital structure realities, fundraising pressures, and competitive intensity in crowded segments.

Across all respondents, the largest share at 36 percent prefers platforms below $100 million EV, followed by 25 percent targeting above $500 million, 23 percent in the $250 to 500 million range, and just 16 percent in the $100 to 250 million band. That middle tranche, once the default hunting ground, now appears comparatively less favored.
This divergence reflects today’s rate environment and liquidity backdrop. Smaller platforms offer multiple arbitrage and operational lift. Larger platforms offer scale, institutional stability, and cleaner exit narratives. The squeezed middle suggests conviction is strongest at the extremes.
Detailed Analysis
Below $100 million EV leads at 36 percent overall, signaling a clear tilt toward smaller entry points where purchase price discipline and roll up strategies can drive returns.
Above $500 million EV attracts 25 percent overall, confirming that large cap platforms remain viable for firms with capital scale and structured financing flexibility.
The $100 to 250 million range is least preferred at 16 percent, indicating a competitive no man’s land where pricing, leverage, and growth profiles may be misaligned.
Bankers skew large, with 34 percent preferring above $500 million EV, reflecting capital markets orientation and comfort with institutional grade assets.
Fund managers skew mid to upper mid, with 38 percent targeting $250 to 500 million EV, suggesting a desire for operational control without mega deal exposure.
Corporate development teams are overwhelmingly small cap oriented, with 67 percent targeting below $100 million EV, consistent with bolt on acquisition strategies.
Consultants show balanced preferences, split evenly at 31 percent for both above $500 million and below $100 million, reinforcing the emerging barbell thesis.
Strategic Implication
Capital is not concentrating in the traditional mid market sweet spot. Instead, conviction is bifurcating. For sponsors, this means sourcing advantages and value creation capabilities will matter more than ever. Competing in the middle without a differentiated edge may prove increasingly difficult.
Incremental Capital Is Tilting Toward Optionality, Not Aggression
Capital allocation inside private equity portfolios is no longer a binary choice between hunting new platforms or doubling down on existing ones. The current environment of higher rates, elongated holding periods, and uneven exit markets is forcing firms to rethink where incremental dollars generate the highest risk adjusted return. This chart reveals a market that is cautious, diversified, and increasingly opportunistic rather than singularly conviction driven.
Across all respondents, capital appears evenly distributed, with 31 percent favoring new platform investments, 31 percent taking an opportunistic deal by deal approach, 20 percent balancing between platforms and add ons, and just 19 percent prioritizing add ons for existing portfolio companies. That symmetry signals hesitation. No single strategy commands majority conviction, suggesting firms are preserving flexibility amid macro and liquidity uncertainty.
More telling is the dispersion across participant types. Bankers, consultants, corporate development teams, investment managers, and PE sponsors are allocating differently based on their vantage point in the deal ecosystem. The divergence underscores a fragmented market where underwriting assumptions, capital costs, and growth visibility vary by seat at the table. Incremental capital today is less about bold expansion and more about strategic calibration.

Detailed Analysis
New platform investments lead overall at 31 percent, tied with opportunistic capital at 31 percent, signaling a split between proactive sourcing and tactical deployment.
Only 19 percent overall prioritize add ons, suggesting consolidation remains important but not dominant in current incremental budgets.
Consultants show the strongest tilt toward new platforms at 44 percent, indicating belief in fresh entry opportunities despite valuation resets.
Corporate development teams skew heavily opportunistic at 42 percent, reflecting flexibility amid strategic M and A pacing.
PE sponsors allocate 40 percent opportunistically, reinforcing that capital is waiting for conviction rather than chasing volume.
Bankers lean toward add ons at 28 percent, the highest among groups, likely reflecting pipeline visibility in bolt on transactions.
Investment managers are evenly split, with 33 percent to new platforms and 33 percent opportunistic, suggesting institutional portfolios are keeping options open.
Strategic Implication
There is no dominant incremental playbook right now. The market is operating in wait and assess mode. Firms that maintain underwriting discipline while preserving dry powder flexibility will be best positioned to deploy aggressively once pricing clarity and exit confidence return.
In a Volatile Market, Defensibility Beats Financial Engineering
When exit visibility is limited and leverage is more expensive, the underwriting lens shifts. Growth narratives and multiple expansion stories give way to durability, predictability, and structural resilience. This chart captures how private market participants are redefining what “quality” means in a new platform investment environment where capital costs are higher and patience is mandatory.
Across all respondents, the most critical attribute cited is a high quality management team at 32 percent, followed by sector positioning with defensible demand characteristics at 27 percent, and a clear add on acquisition pipeline at 22 percent. Only 19 percent prioritize strong standalone cash flow as the single most important factor. That hierarchy is telling. Sponsors are underwriting people and positioning ahead of pure financial profile.
But the dispersion across market participants reveals deeper philosophical divides. Bankers emphasize management strength. Consultants emphasize sector defensibility. Corporate development leaders value team and integration potential. PE sponsors lean heavily into sector positioning. The modern platform thesis is less about squeezing cash flow and more about owning businesses that can survive macro shocks while compounding operationally over time.

Detailed Analysis
High quality management leads overall at 32 percent, making leadership the primary underwriting filter in today’s environment.
Sector defensibility ranks second at 27 percent overall, signaling demand stability is increasingly prized amid economic uncertainty.
Add on pipeline importance at 22 percent confirms consolidation remains central, but not dominant, in platform selection.
Strong standalone cash flow trails at 19 percent, suggesting that cash generation alone is insufficient without growth or structural advantage.
Bankers overwhelmingly prioritize management at 45 percent, reflecting confidence in execution driven narratives.
Consultants favor sector positioning at 43 percent, the highest concentration among any group, reinforcing a thematic and macro aware investment lens.
Corporate development teams emphasize management at 40 percent and add on pipeline at 30 percent, consistent with integration and operational execution focus.
PE sponsors place the greatest weight on sector defensibility at 44 percent, underscoring a clear shift toward owning resilient end markets.
Strategic Implication
In the current cycle, resilience outranks optimization. The winning platforms will not simply generate cash, they will operate in sectors with structural demand tailwinds, led by management teams capable of compounding through uncertainty. Underwriting has moved from spreadsheet engineering to strategic durability.
Platform Entry Strategy Is Shifting From Expansion to Selectivity
Over the past twelve to eighteen months, private equity firms have not abandoned platform investing, but they have recalibrated how they approach it. The environment of elevated rates, longer hold periods, and uneven exit markets has forced sponsors to reexamine entry discipline. The result is not retrenchment, but refinement. Firms are adjusting size targets, underwriting thresholds, and portfolio construction logic rather than stepping away from platform formation altogether.
Across all respondents, the responses are strikingly balanced. 28 percent are maintaining similar entry sizes but becoming more selective. Another 28 percent are pulling back on new platforms in favor of portfolio work. 25 percent are targeting smaller initial platforms with expansion upside. Only 20 percent report being willing to pay up for scarcity quality assets. That distribution signals caution. The dominant mindset is defensive positioning and precision, not aggressive multiple expansion.
The breakdown across participant groups reveals more conviction among sponsors than intermediaries. PE sponsors show a stronger commitment to maintaining entry sizes with tighter screening. Corporate development teams are pulling back more decisively. Bankers remain comparatively balanced across strategies. The takeaway is clear: platform investing is alive, but the underwriting bar has moved higher.

Detailed Analysis
Maintaining similar entry sizes but being more selective leads at 28 percent overall, indicating discipline rather than contraction.
Pulling back toward portfolio work also stands at 28 percent, reflecting prioritization of value creation over new platform risk.
Targeting smaller initial platforms at 25 percent supports the growing preference for lower entry multiples with expansion runways.
Only 20 percent overall are willing to pay up for scarcity quality assets, confirming limited appetite for premium pricing in the current cycle.
PE sponsors are the most committed to maintaining entry sizes at 40 percent, suggesting larger funds remain active but highly selective.
Corporate development teams show the highest pullback at 38 percent, signaling strategic caution inside corporate balance sheets.
Bankers distribute responses evenly around the mid 20 percent range, reflecting transaction market neutrality.
Willingness to pay up is lowest among corporate development at 13 percent, reinforcing valuation sensitivity.
Strategic Implication
The market is not shrinking. It is sharpening. Firms that can source differentiated platforms at disciplined valuations will continue deploying capital. Those relying on aggressive pricing or financial engineering alone will struggle. Platform investing now demands patience, selectivity, and a clearer value creation thesis at entry.
Dry Powder Is Getting Younger and That Changes the Clock
Global buyout dry powder is not just large, it is increasingly fresh. The composition by vintage shows a clear rotation toward newer capital, meaning a greater share of undeployed commitments sits in funds raised within the last two years. That matters because capital age dictates behavior. Younger funds can afford patience. Older funds cannot.
In 2025, 52 percent of global buyout dry powder is between one and two years old, while another 6 percent is less than one year old. Together, that means nearly 58 percent of capital is under two years old. Compare that to 2018, when only 24 percent was less than one year old and 47 percent was in the one to two year band. The shift is subtle but powerful. Capital is skewing younger even as total industry AUM remains elevated.
At the same time, the share of capital aged two to three years has jumped to 25 percent in 2025, nearly double historical averages. Older vintages beyond four years remain relatively contained at 9 percent, but that bucket is creeping upward compared to 2023 and 2024. The message is clear. The industry is not yet under systemic deployment pressure, but the clock is ticking louder for 2021 and 2022 vintages.

Detailed Analysis
One to two year old capital dominates at 52 percent in 2025, up from 47 percent in 2018 and 50 percent in 2023, signaling concentration in relatively fresh funds.
Less than one year capital has compressed to 6 percent, down sharply from 24 to 26 percent levels seen in 2018 and 2019, reflecting slower fundraising momentum.
Two to three year capital has surged to 25 percent, more than double its 9 to 14 percent range in prior years, suggesting a backlog forming in mid cycle vintages.
Capital older than four years remains below 10 percent, limiting immediate forced deployment risk but gradually building.
The 2024 profile showed 61 percent in the one to two year bucket, indicating that 2022 and 2023 fundraising waves are now moving into the pressure zone.
The relative stability in the three to four year and greater than four year cohorts implies discipline so far, but that cushion narrows as vintages age simultaneously.
Strategic Implication
The industry is entering a transition window. Capital is still young enough to avoid panic pricing, but large 2021 to 2023 vintages are approaching the period where deployment urgency intensifies. If deal flow accelerates, competition will sharpen quickly. If it does not, expect more creative structures, minority deals, and GP led solutions to absorb the growing middle aged dry powder.
Buyout Multiples Are Back at the Ceiling
Valuation discipline has been the defining debate in private equity over the past three years. After the 2021 peak and the subsequent rate shock, many expected buyout pricing to reset meaningfully. Instead, the data tells a more complicated story. Multiples compressed briefly, stabilized, and are now pushing back toward record territory. The rebound is not just cyclical. It reflects structural capital supply meeting limited quality inventory.
Buyout EV to EBITDA multiples have climbed from 10.7x in 2023 to 11.3x in 2024 and now 11.8x in 2025, matching the 2022 level and approaching the 11.7x peak in 2021. Public market multiples have moved in parallel, reaching 14.0x in 2025, up from 11.4x in 2023. The valuation gap between private and public markets remains intact, but both are operating at historically elevated ranges.
What is striking is not just the absolute level, but the resilience. Despite higher borrowing costs and tighter credit conditions relative to 2020 and 2021, entry pricing has not materially retrenched. That suggests either confidence in earnings durability or a persistent overhang of capital competing for fewer scaled assets. In either case, underwriting assumptions must carry more of the return burden.

Detailed Analysis
Buyout multiples rose to 11.8x in 2025, up from 10.7x in 2023, signaling renewed pricing pressure.
The 2021 peak of 11.7x was briefly matched in 2022 before dipping, making the 2025 level effectively a return to prior highs.
Public market multiples stand at 14.0x in 2025, maintaining a premium over private buyouts.
The private to public valuation gap has remained relatively stable across cycles, suggesting correlated market sentiment.
From 2016 at 8.5x to 2025 at 11.8x, buyout pricing has expanded by more than three turns over a decade.
The modest compression in 2023 proved temporary rather than structural, reinforcing that capital supply remains strong.
Strategic Implication
The multiple tailwind is no longer reliable. With entry valuations near cycle highs, value creation must increasingly come from operational improvement, margin expansion, and strategic repositioning rather than financial engineering or multiple arbitrage. Sponsors who underwrite conservative exit assumptions and prioritize cash flow resilience will be better positioned if public market sentiment softens again.
Deal Activity Hinges on Pricing Alignment, Not Just Rates
For the past two years, market participants have debated what will truly unlock new deal flow. Lower rates have dominated headlines, but this survey data suggests a more nuanced reality. The constraint on transactions is less about the absolute cost of capital and more about alignment between buyers and sellers. Until that gap closes, capital will remain cautious.
On a scale of one to ten, narrowing the valuation gap scores highest at 6.6, followed by increased assets coming to market from PE at 6.1 and increased macro visibility at 6.0. Falling interest rates rank at 5.6, while corporate divestitures score 5.2 and reduced spreads trail at 4.7. The hierarchy is clear. Pricing consensus and supply dynamics matter more than incremental improvements in financing conditions.
This reframes the narrative. While monetary easing helps, it is not the primary catalyst. Sellers need conviction that exit multiples are stable. Buyers need confidence that earnings are durable. Without those two ingredients, rate cuts alone will not revive transaction velocity. Deal flow is fundamentally a confidence equation.

Detailed Analysis
Narrowing the valuation gap leads at 6.6, confirming that buyer seller misalignment remains the single largest friction point.
Increased PE sponsored assets coming to market scores 6.1, suggesting backlog clearance is critical for momentum.
Macro visibility at 6.0 highlights the importance of economic clarity over raw liquidity.
Falling interest rates at 5.6 matter, but they are not viewed as the decisive trigger.
Corporate divestitures score 5.2, indicating moderate optimism around strategic carve outs.
Reduced credit spreads rank lowest at 4.7, signaling that financing market mechanics are secondary to valuation psychology.
Strategic Implication
Sponsors waiting for rate cuts alone may be disappointed. The true unlock will come when sellers recalibrate price expectations and buyers regain confidence in forward earnings. Until then, expect selective processes, structured deals, and creative bridge solutions rather than a broad based deal surge.
Exit Optimism Is Catching Up to Acquisition Confidence
For most of the past year, private equity has operated with a clear imbalance. Sponsors were confident in their ability to acquire assets, but far less certain about their ability to exit them. That divergence created a liquidity bottleneck, lengthened holding periods, and forced greater reliance on continuation vehicles and structured solutions. This chart suggests that imbalance may finally be narrowing.
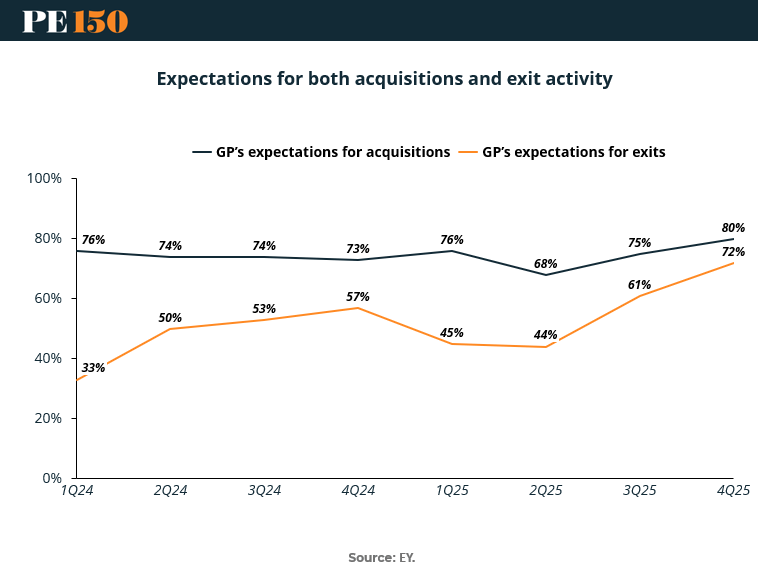
GP expectations for acquisitions have remained consistently elevated, hovering between 73 percent and 76 percent through 2024 before dipping to 68 percent in 2Q25 and rebounding to 80 percent by 4Q25. Exit expectations tell a more volatile story. Starting at just 33 percent in 1Q24, optimism climbed steadily to 57 percent by 4Q24, fell back to the mid 40s in early 2025, and then surged to 72 percent by 4Q25. The gap between buy and sell confidence has compressed meaningfully.
The significance is not just the rise in exit sentiment, but the convergence itself. When acquisition and exit expectations move in tandem, transaction velocity tends to follow. Confidence on both sides of the capital cycle is the precondition for liquidity normalization.
Detailed Analysis
Acquisition optimism peaks at 80 percent in 4Q25, marking the strongest reading in the series.
Exit expectations climb to 72 percent in 4Q25, more than doubling from 33 percent in 1Q24.
The acquisition exit gap narrows from 43 percentage points in 1Q24 to just 8 points by 4Q25, signaling improved liquidity outlook.
The dip in both measures during 2Q25 suggests temporary macro or rate driven uncertainty before confidence returned.
Exit optimism shows greater volatility than acquisition sentiment, reinforcing that liquidity remains more sensitive to market conditions.
Sustained acquisition confidence above 70 percent throughout most quarters indicates persistent deployment appetite despite slower exits.
Strategic Implication
If exit expectations hold near current levels, 2026 could mark the first broadly synchronized buy and sell cycle since the rate shock. That alignment would ease DPI pressure, accelerate capital recycling, and potentially intensify competition for quality assets. The key risk remains whether exit confidence proves durable or reactive to short term macro signals.
While global buyout multiples have broadly converged over the past decade, a persistent transatlantic gap remains. This five year average comparison highlights a structural pricing premium in the United States relative to Europe. The difference is not dramatic, but it is durable. And durability in valuation spreads often reflects deeper ecosystem factors rather than temporary market cycles.
The median private equity buyout multiple over the past five years stands at 12.3x EV to EBITDA in the US, compared to 11.8x in Europe. A half turn gap may appear modest, but across billion dollar enterprise values it translates into meaningful capital differences. That premium reflects stronger growth expectations, deeper capital markets, sector mix, and historically higher exit valuations in the US.
Importantly, this is an average across volatile years that included the 2021 peak and subsequent rate reset. The persistence of the spread suggests that US assets continue to command stronger competitive bidding dynamics. For global sponsors allocating capital across regions, that differential forces a constant trade off between scale and relative value.

Detailed Analysis
US median multiple at 12.3x exceeds Europe’s 11.8x by roughly half a turn.
Over a five year average, the premium indicates structural pricing differences rather than short term rate effects.
Higher US multiples likely reflect stronger revenue growth profiles and a heavier weighting toward technology and healthcare sectors.
European markets may offer marginal entry discounts, but often with slower growth or more fragmented exit markets.
For global funds, currency considerations can amplify or compress the effective spread.
In competitive auction environments, US processes tend to attract broader sponsor participation, reinforcing pricing resilience.
Strategic Implication
The US premium raises the bar for value creation. Sponsors paying 12x plus must underwrite operational acceleration and durable growth. Europe may offer relative valuation breathing room, but return dispersion will depend on sector selection and cross border exit optionality. Geographic allocation is no longer just about exposure. It is about margin for error at entry.
Europe Is Leaning More Conservative in LBO Structuring
As valuation multiples remain elevated and financing costs reset higher, capital structure discipline has quietly become one of the most important differentiators in buyout underwriting. This final chart highlights a subtle but meaningful divergence between European and US leveraged buyouts, not in pricing, but in structure. Equity contribution and interest coverage ratios reveal how sponsors are managing risk across regions.
On average, European LBOs are financed with 45.4 percent equity, compared to 42.8 percent in the US. That roughly three point difference signals a slightly more conservative capital stack in Europe. The contrast becomes clearer when examining interest coverage. European deals show an average coverage ratio of 3.6x, while US deals sit at 3.0x. In an environment where rates are structurally higher than the 2020 to 2021 window, coverage matters more than headline leverage.
Taken together, these metrics suggest European sponsors are underwriting with a larger equity cushion and stronger debt service capacity. US sponsors, while still disciplined relative to prior cycles, are operating with marginally tighter buffers. The difference is not dramatic, but in stressed scenarios, half a turn of coverage can determine flexibility.

Detailed Analysis
European equity contribution averages 45.4 percent, compared to 42.8 percent in the US, indicating modestly lower leverage.
The three point equity gap translates into meaningful downside protection in volatile earnings scenarios.
Interest coverage of 3.6x in Europe exceeds the US average of 3.0x, suggesting stronger debt servicing capacity.
Lower coverage in US deals implies greater sensitivity to earnings compression or rate volatility.
Higher European equity inputs may reflect lender conservatism, regulatory differences, or sector mix.
Structuring discipline becomes increasingly critical when entry multiples are above 11x across regions.
Strategic Implication
With buyout multiples near cycle highs and exit timing still uncertain, capital structure resilience is the silent variable driving risk adjusted returns. Sponsors that build in equity cushions and preserve coverage flexibility will have greater optionality if growth slows or refinancing windows tighten. In this cycle, structure may matter as much as strategy.
Conclusion
The throughline across every dataset in this report is discipline.
Sponsors are gravitating toward extremes in platform sizing, not because they are chasing novelty, but because conviction now requires clarity. Incremental capital is being deployed selectively. Quality is defined less by cash flow optics and more by durability of demand and leadership strength. Entry strategies are sharpening, not expanding. And while dry powder remains substantial, the aging curve is moving steadily forward.
Valuations have proven resilient. That resilience eliminates the easy narrative of a reset cycle. With buyout multiples near prior highs and US assets still commanding premiums, underwriting assumptions must carry more of the return load. At the same time, European structures show that conservative equity contributions and stronger coverage ratios are quietly becoming a competitive advantage.
Perhaps most importantly, exit confidence is beginning to catch up with acquisition appetite. If that convergence holds, 2026 may represent the first synchronized buy and sell cycle since the post pandemic surge. But that outcome depends less on rate cuts and more on valuation alignment and macro clarity.
This is a market where patience still pays, but only if paired with precision.
The firms that outperform in the next phase will not be those that deploy fastest or pay highest. They will be those that structure wisely, underwrite conservatively, and create value operationally in assets that can withstand volatility.
The easy money phase is over.
The disciplined capital phase has begun.
Sources & References
McKinsey. Global Private Markets Report 2026. https://www.mckinsey.com/industries/private-capital/our-insights/global-private-markets-report
CVC. Private Wealth. https://www.cvc.com/cvc-private-wealth/insights/2026/cvc-private-wealth-2026-private-equity-and-credit-outlook/
EY. Private Equity Pulse. https://www.ey.com/en_gl/insights/private-equity/pulse
PE150. Platform and Deal Sizing Microsurvey. https://www.pe150.com/p/platform-preferences-are-drifting-upstream
PE150. Where Incremental Capital Is Flowing. https://www.pe150.com/p/where-incremental-capital-is-flowing-platforms-add-ons-and-opportunism-in-private-equity
PE150. Underwriting a new platform. https://www.pe150.com/p/what-matters-most-when-underwriting-a-new-platform-today
Pe150. Platform Investing. https://www.pe150.com/p/platform-investing-is-getting-smaller-sharper-and-slower
Premium Perks
Since you are an Executive Subscriber, you get access to all the full length reports our research team makes every week. Interested in learning all the hard data behind the article? If so, this report is just for you.
|
