- PE 150
- Posts
- The Rise of New Products in the Private Markets
The Rise of New Products in the Private Markets
This report examines how structural shifts in capital formation, liquidity management, and credit intermediation are reshaping the architecture of the private markets.

I. Executive Summary
This report examines how structural shifts in capital formation, liquidity management, and credit intermediation are reshaping the architecture of the private markets. Across evergreen vehicles, continuation funds, and private credit structures, a common theme emerges: capital continuity is replacing episodic deployment, and liquidity is increasingly engineered rather than discovered.
Evergreen Capital: From Vintage Exposure to Persistent Allocation
The migration from close-end drawdown funds to evergreen and open-ended structures represents a fundamental redesign of private market access. US unlisted evergreen net AUM expanded from approximately $245 billion in 2022 to $493 billion in 2025, implying mid-20 % annualized growth. Active evergreen fund count rose from 131 vehicles in 2018 to 505 by 2025, signaling product institutionalization rather than tactical experimentation.
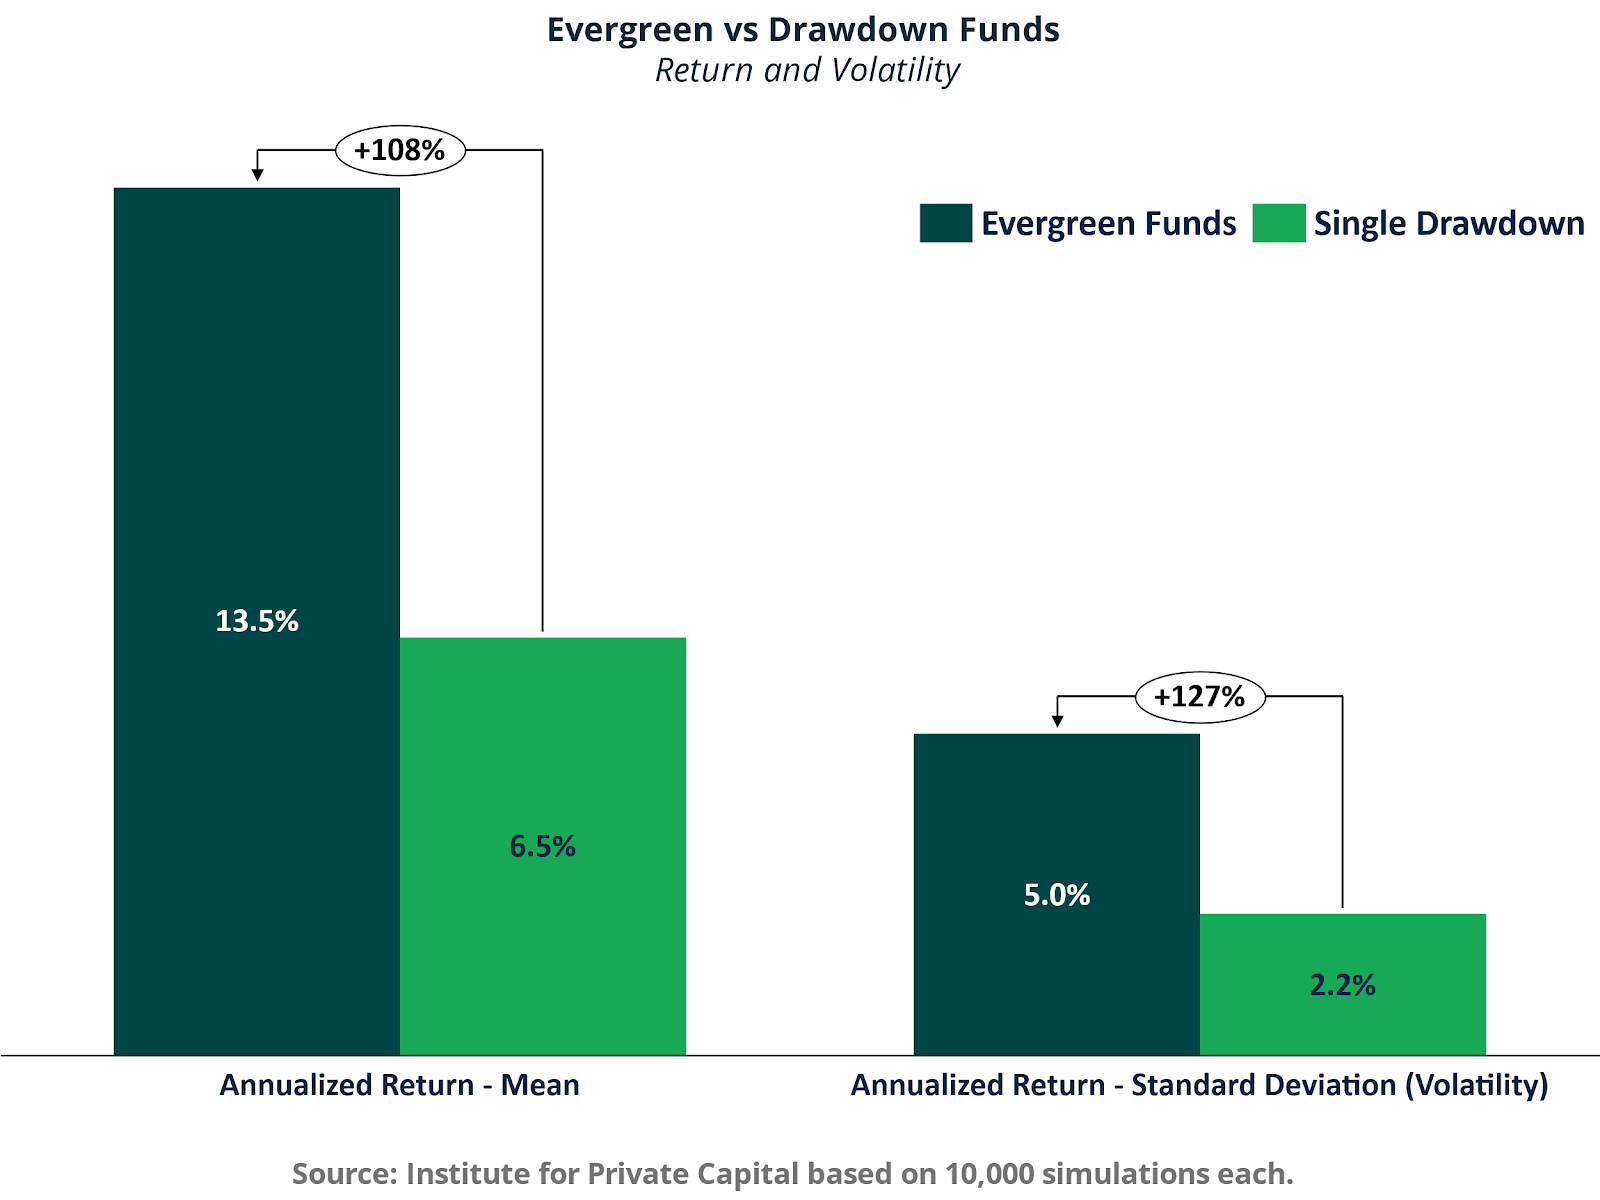
Simulation evidence demonstrates that structure alone can materially alter outcomes. A single drawdown fund with only 28.7% average capital invested generated a 6.5% mean annual return. In contrast, an evergreen structure maintaining roughly 90% capital deployment produced a 13.5% mean annual return under identical asset assumptions. The performance differential is attributable to capital efficiency and exposure stability, not asset selection. Evergreen vehicles internalize reinvestment and minimize cash drag, improving geometric compounding.
Within the evergreen ecosystem, interval and tender offer funds have scaled rapidly. Combined assets exceeded $225 billion by 2025, reflecting demand for semi-liquid wrappers that balance periodic redemption features with underlying illiquid exposures. The result is structural convergence between private-market return streams and public-market accessibility.
Continuation Funds: Liquidity in a Constrained Exit Cycle
Continuation vehicles have evolved from niche secondary solutions into core liquidity instruments. Global PE-backed exits peaked at $1.72 trillion in 2021, then fell to $808 billion in 2022 and $751 billion in 2023, before partially recovering to $887 billion in 2024 and an estimated $832 billion in 2025. Despite improvement, exit volumes remain roughly half the 2021 peak, creating a backlog of aging assets.
As traditional exits slowed, continuation funds expanded. They now represent nearly one in five sponsor-backed exits in early 2025. Capital raised for continuation vehicles reached $52.9 billion in 2025, up from less than $1 billion in 2015. At the same time, liquidity demand is rising faster than secondary capital supply, with liquidity needs estimated at 5.5 times available GP-Led buyout secondary capital by 2026.
The structural driver is extended holding periods. Assets once exited within four to five years are now frequently held six to seven years or longer. Higher financing costs and reduced multiple expansion have lengthened value creation timelines. Continuation funds allow sponsors to reset the ownership duration, provide optional liquidity to LPs, and preserve exposure to high-conviction assets without forcing discounted exits.
The economic logic mirrors evergreen capital continuity, but at the asset level. Continuation vehicles reduce reinvestment timing risk for rollover investors and separate asset duration from fund duration. Their durability will depend on disciplined governance, transparent pricing, and alignment of interests.
Private Credit: Beneficiary of Bank Retrenchment
Private credit has transitioned from opportunistic capital to a central pillar of global credit markets. Assets grew from approximately $0.5 trillion in 2013 to $2.1 trillion in 2023 and are estimated to be near $3 trillion in 2025, with projections of $5 trillion by 2029. North America remains dominant, but Europe and other regions have expanded materially.
The addressable opportunity remains substantial. Total US lending balances approach $34 trillion, with nonbank penetration still modest across several segments. Even incremental market share gains represent trillions of dollars in potential expansion.
Performance evidence underscores structural resilience. Over ten years, private credit generated an average IRR of 8.2% versus 4.7% for public loans and 3.7% for high yield on a comparable basis. The Sharpe ratio of 1.2 exceeds that of high-yield leveraged loans and corporate bonds, indicating superior risk-adjusted efficiency. In rising-rate environments, floating-rate exposure preserved income, with direct lending delivering approximately 11.6% returns versus 5.0% for leveraged loans.
Default and recovery statistics further reinforce the thesis. Sponsored leveraged loans exhibit materially lower default rates than non-sponsored loans, and secured structures demonstrate higher recovery rates than unsecured bonds. The maturity ladder of private credit portfolios is staggered, with limited near-term refinancing pressure and larger concentrations in 2028 and beyond, reducing systemic rollover risk.
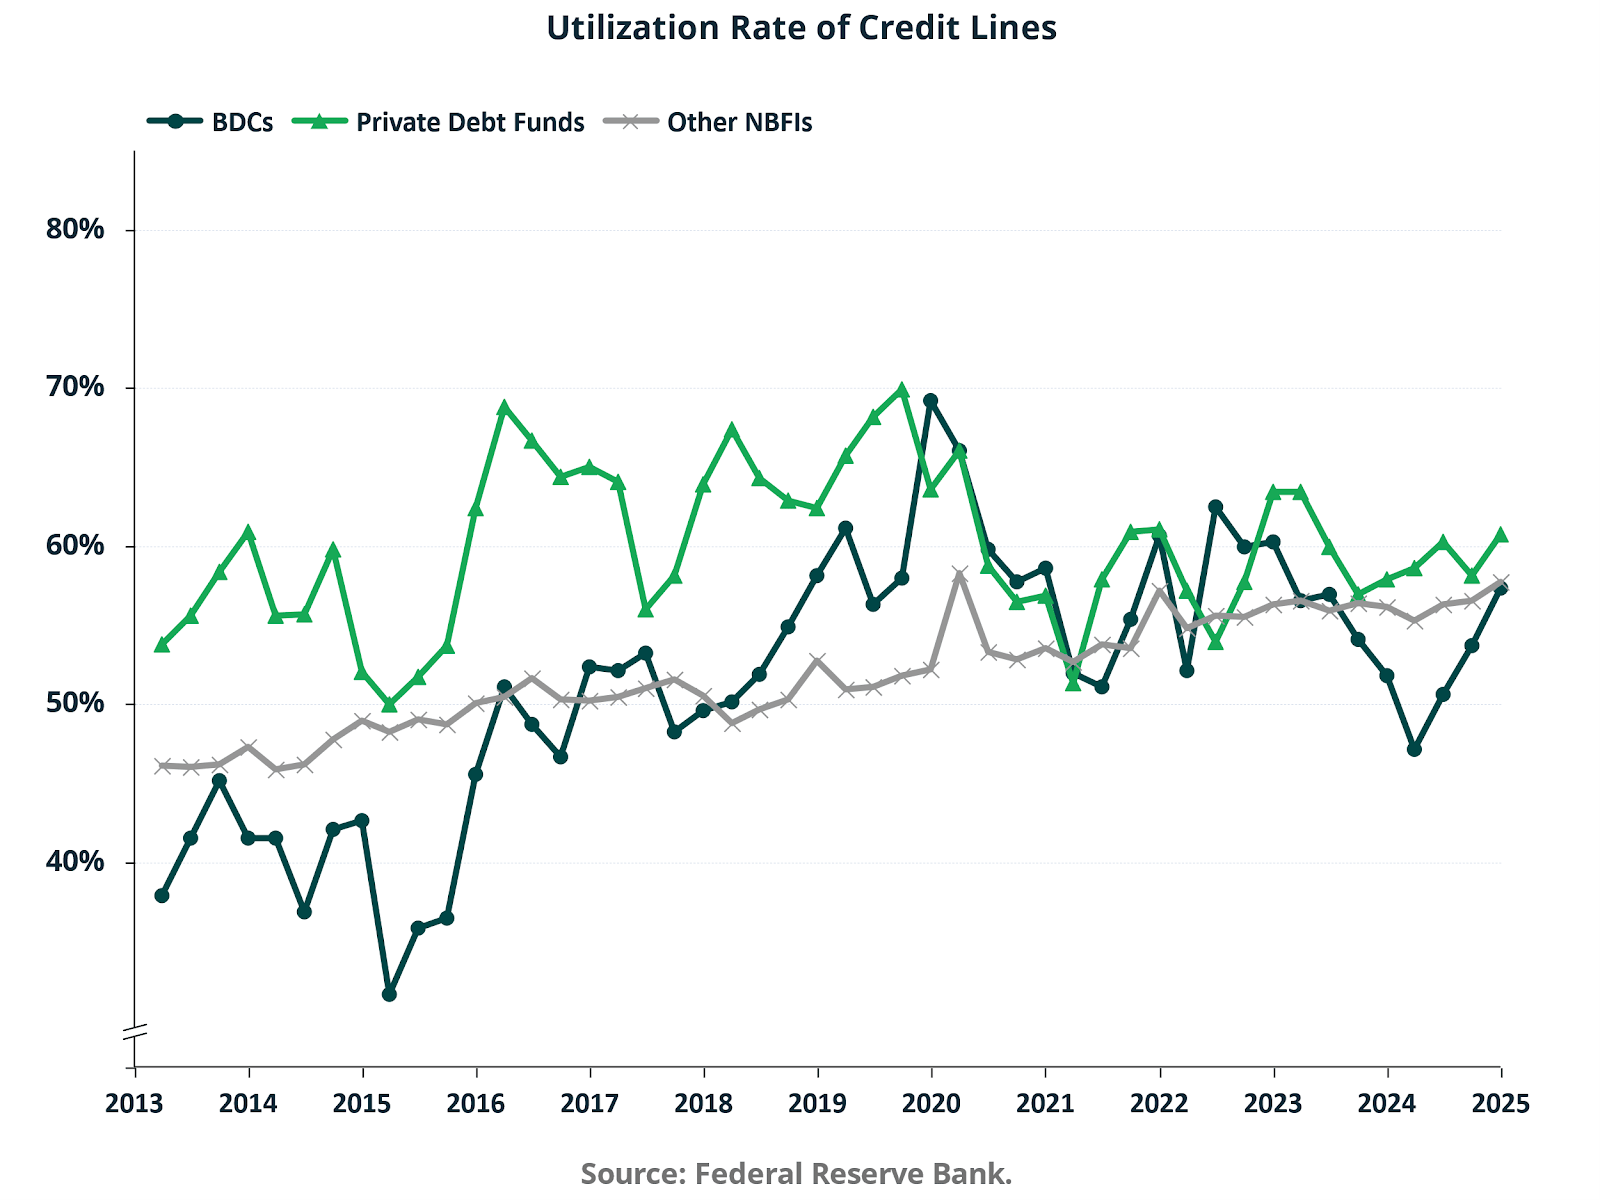
Bank funding relationships appear institutional rather than fragile. Utilization rates for BDCs and private debt funds remain in the mid-50% range, average ratings are BBB, delinquency rates remain below 1%, and facility tenors average between 2.6 and 4.1 years. Indexed utilization growth since 2013 reflects industry scaling, not excessive leverage.
Structural Convergence: The New Private Market Architecture
Across evergreen vehicles, continuation funds, and private credit, the underlying economic principle is consistent. Capital continuity enhances compounding efficiency. Structural liquidity solutions reduce timing risk. Floating rate credit and secured underwriting improve resilience in volatile macro environments.
The traditional model of discrete fundraising, finite fund lives, and binary exits is giving way to a more continuous ecosystem characterized by perpetual capital, staged liquidity, and secondary trading as a core function. The private markets are becoming deeper, more internally liquid, and more structurally integrated with institutional balance sheets.
The rise of these products is not cyclical innovation, driven by temporary dislocation. It is a rational response to longer asset duration, higher capital costs, and more complex capital structures. The private market model is evolving toward permanence, scale, and engineered liquidity.
For allocators and sponsors alike, the central question is no longer whether the private markets can scale. The evidence indicates they already have. As Dorota Kowalski, Senior Director, Fund Administration at Juniper Square, notes, “Product innovation is outpacing operating model innovation. Teams designed for closed-end structures suddenly need real-time cash forecasting, credit servicing workflows, daily liquidity tracking, and NAV oversight every week instead of every quarter.” The strategic challenge is how to allocate across structures to maximize capital efficiency, align liquidity with liability profiles, and preserve underwriting discipline in a market defined by structural transformation.
II. Evergreen and Open-Ended Private Vehicles
The migration from closed-end drawdown funds toward evergreen and open-ended private vehicles represents a structural redesign of capital formation rather than incremental product innovation. The core economic shift is from episodic exposure to persistent exposure. In the traditional drawdown model, capital is committed upfront, deployed gradually, and ultimately returned through realizations that may leave investors managing reinvestment risk and idle balances. Evergreen vehicles internalize reinvestment within the fund structure, stabilizing capital deployment and compressing cash drag.
This structural transition is visible in aggregate asset growth.
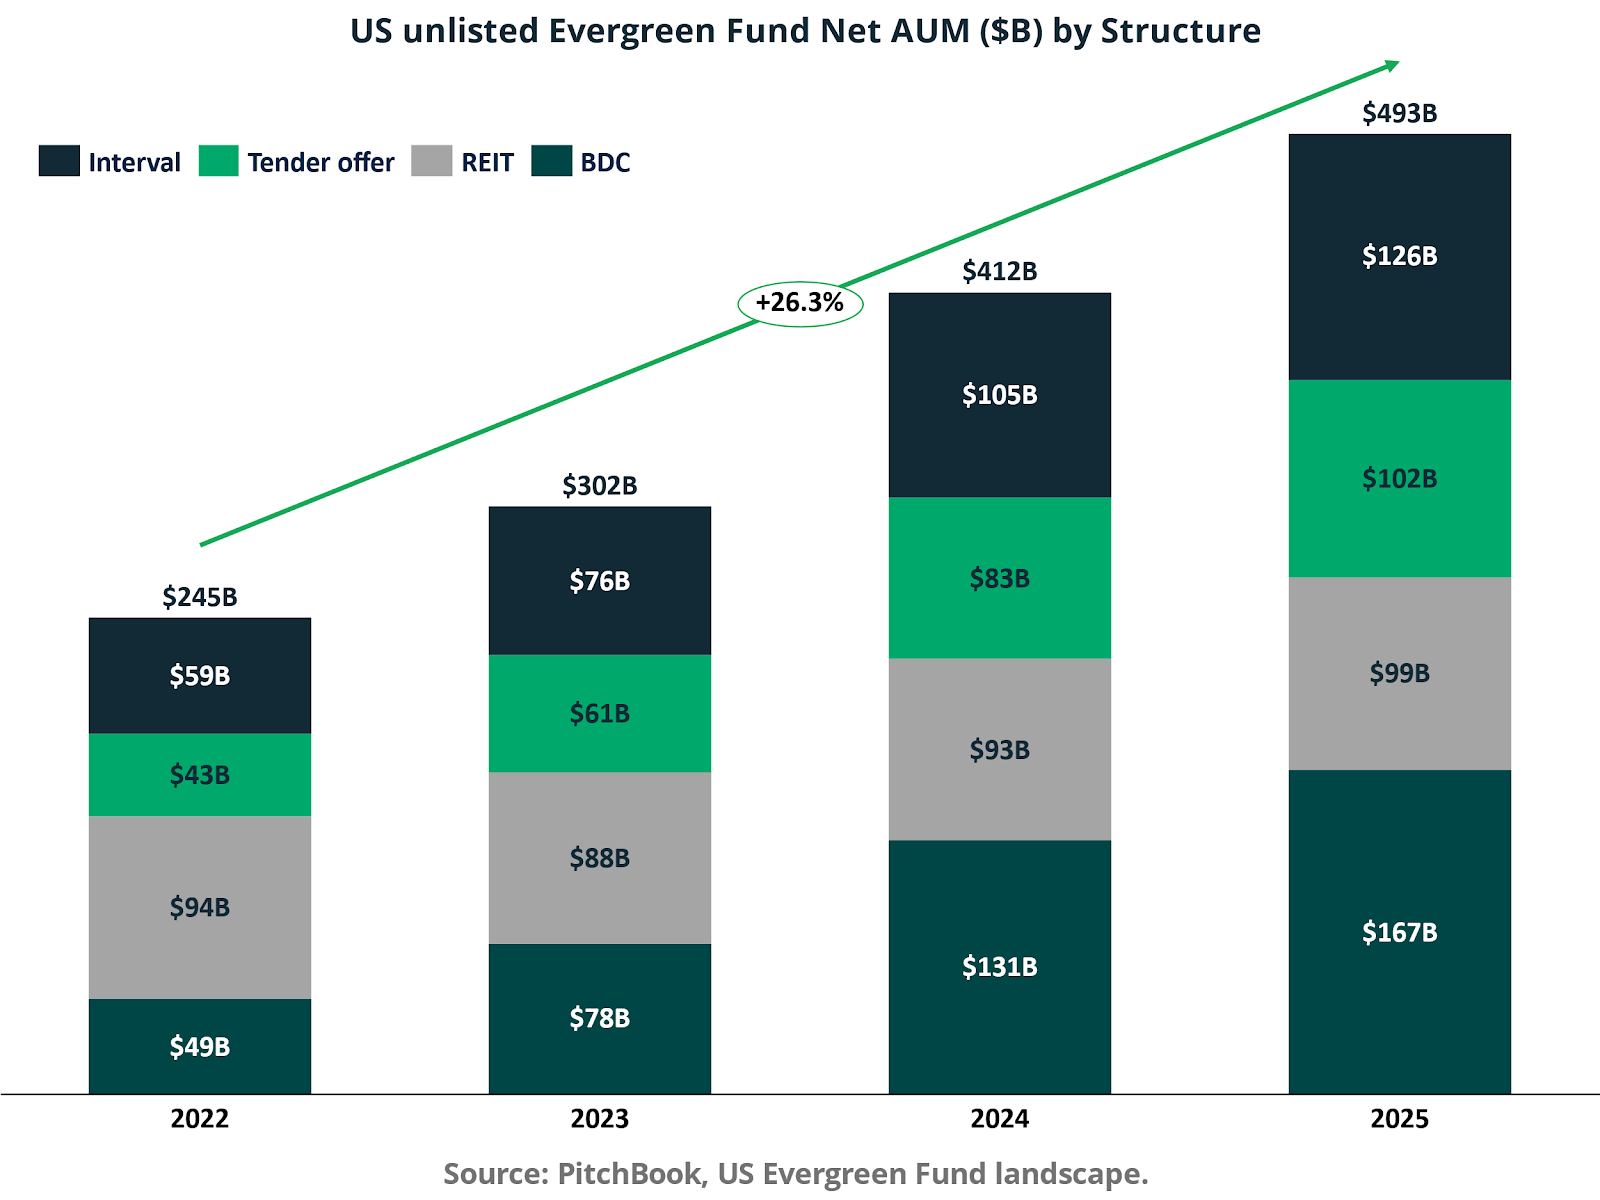
US unlisted evergreen net AUM increased from approximately $245 billion in 2022 to $493 billion by 2025. This $248 billion expansion over three years implies a compound growth rate in the mid-20% range, materially exceeding the pace of traditional closed-end fundraising over the same period. Growth has not been uniform across structures. Business Development Companies expanded from $49 billion in 2022 to $167 billion in 2025, representing the largest absolute contribution. Interval funds grew from $59 billion to $126 billion, while tender offer funds increased from $43 billion to $102 billion. By contrast, non-traded REITs remained relatively stable, rising only modestly from $94 billion to $99 billion. The composition of growth indicates that evergreen scaling is being driven primarily by private credit and multi-asset strategies rather than legacy real estate wrappers.
Product proliferation reinforces the argument that evergreen capital has reached institutional scale.
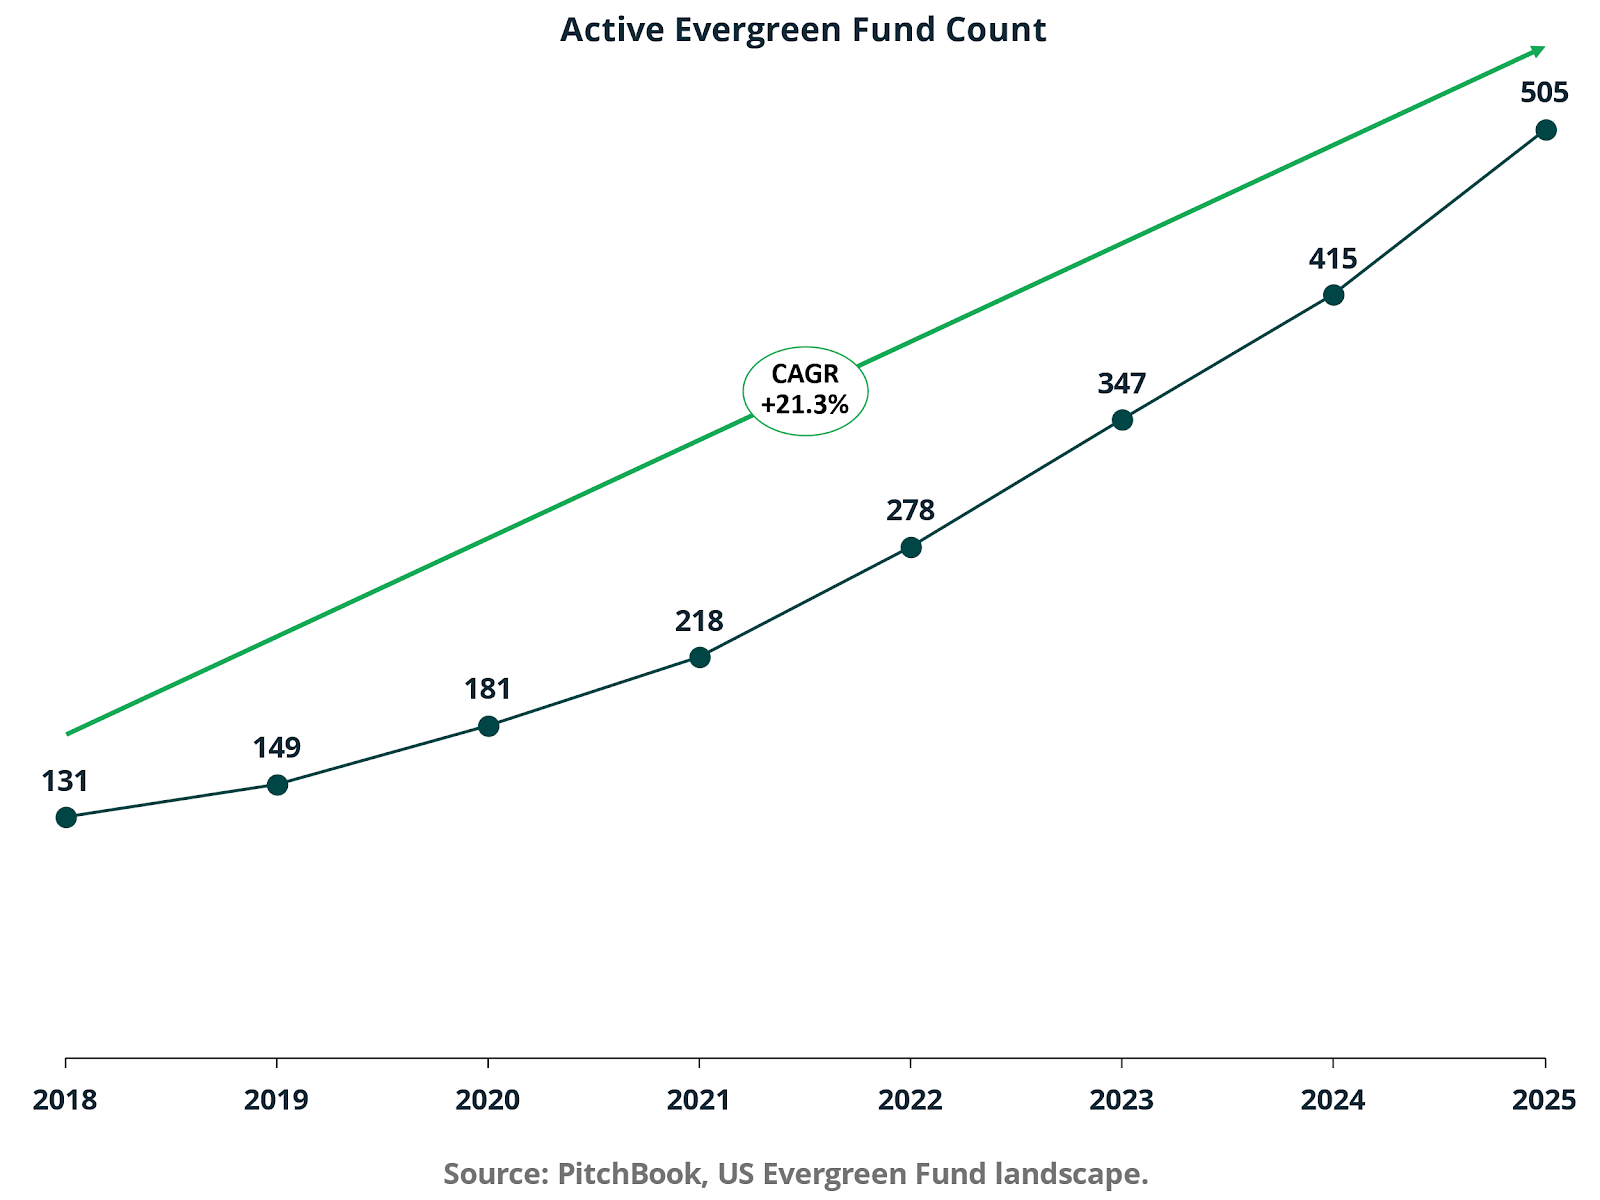
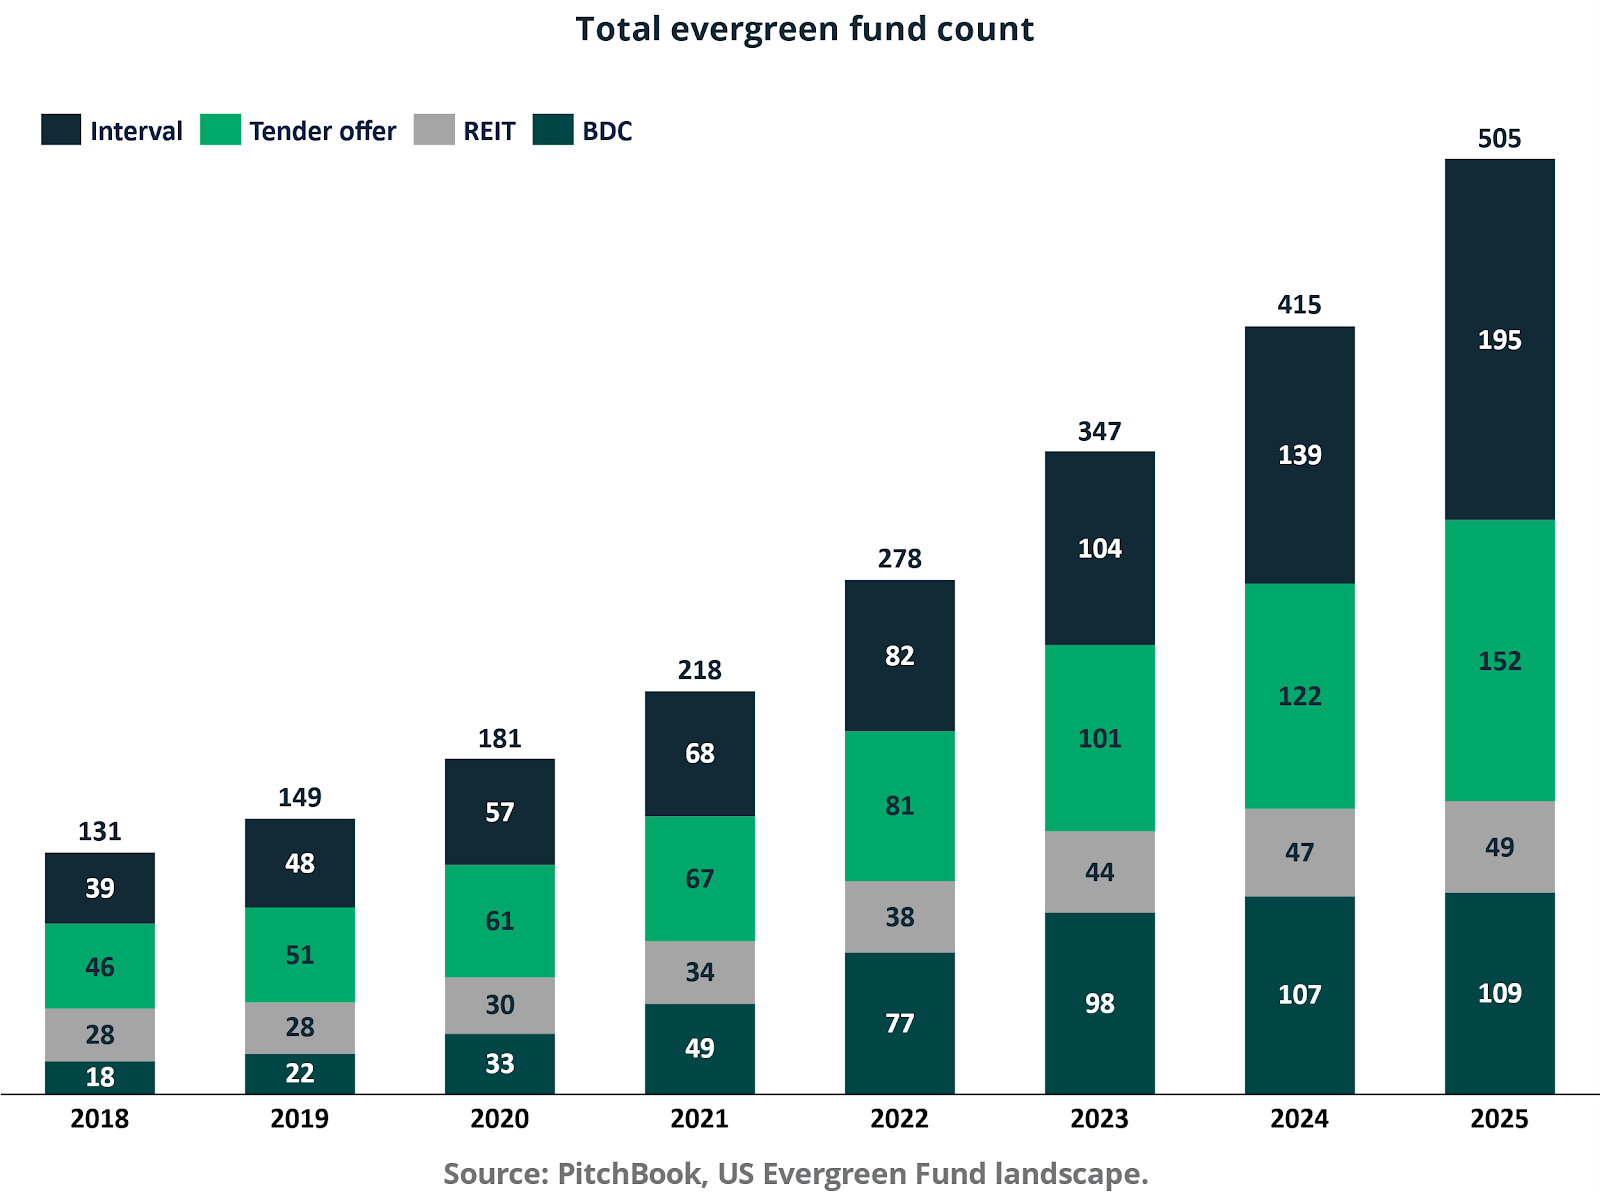
The number of active evergreen funds increased from 131 in 2018 to 505 by 2025, implying a compound annual growth rate of approximately 21%. Acceleration is particularly evident after 2021, with fund count rising from 218 in 2021 to 278 in 2022, 347 in 2023, 415 in 2024, and 505 in 2025. This expansion signals not only investor demand but also sponsor commitment to operationalizing continuous capital structures across credit, secondaries, and diversified private capital strategies.
New launches provide additional evidence of structural institutionalization.
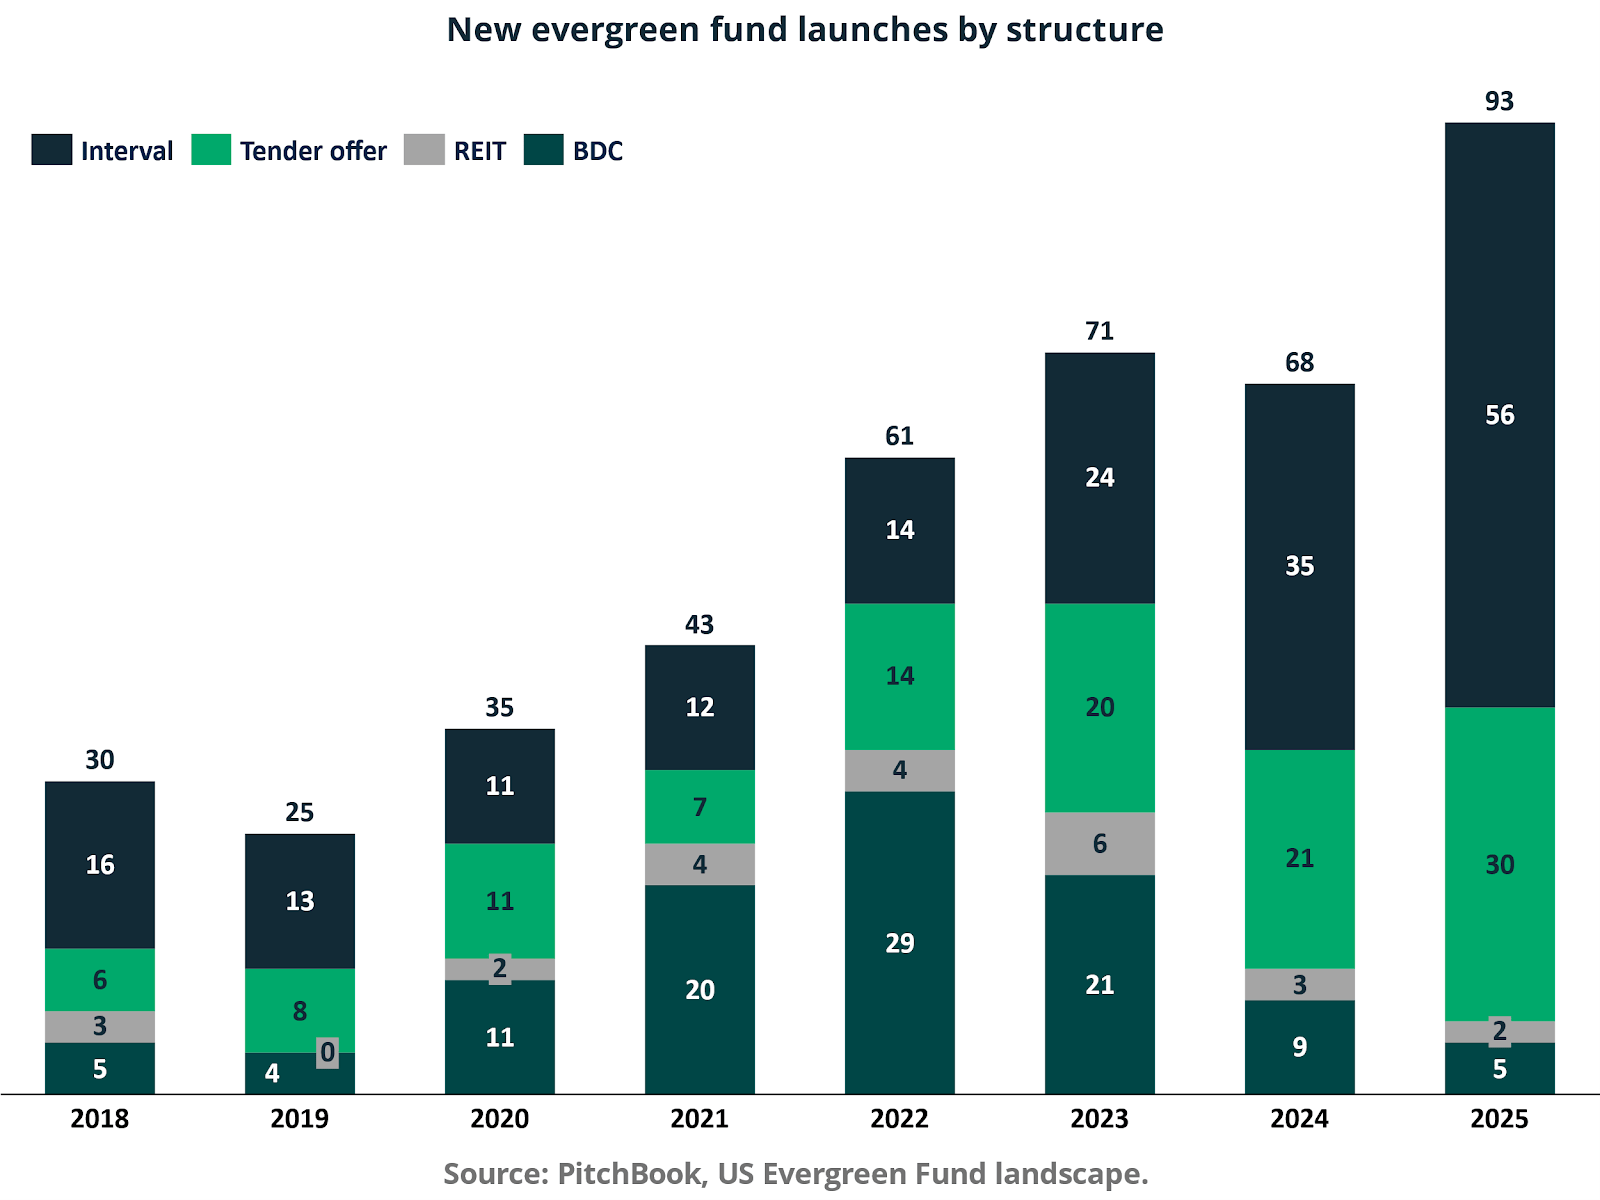
Annual launches increased from 30 vehicles in 2018 to 93 in 2025. Interval fund launches rose from 16 in 2018 to 56 in 2025, while tender offer launches increased from 6 to 30 over the same period. BDC launches peaked at 29 in 2022 before moderating to 5 in 2025, reflecting earlier adoption and subsequent consolidation. REIT launches remained limited throughout, reinforcing that the secular growth of evergreen capital is concentrated in credit-oriented and multi-strategy formats. The sustained pace of launches suggests that evergreen capital has transitioned from experimental to mainstream within private markets distribution channels.
The structural economic rationale for evergreen vehicles is grounded in capital continuity and compounding efficiency. As outlined in the framework in Evergreen and Continuous Capital, drawdown funds typically compound at the individual deal level, with reinvestment decisions effectively externalized to limited partners. Continuation vehicles extend asset duration selectively but still operate within finite fund terms. Evergreen funds compound at the portfolio level by design, with the general partner centrally managing reinvestment and maintaining a persistently invested allocation.
The compounding differential is not theoretical. Simulation evidence in the referenced analysis indicates that a single drawdown fund structure generated a 6.5% mean annual return because only 28.7% of committed capital was invested on average. By contrast, both evergreen funds and engineered rolling drawdown series maintained approximately 90% average investment levels. Despite identical asset-level assumptions and beta exposure of roughly 0.91, the evergreen structure produced a 13.5% annual return versus 12.7% for the rolling drawdown series. The return gap is attributable to exposure stability and reduced volatility in the invested fraction, not to superior asset selection. Capital continuity mitigates compounding drag arising from reinvestment gaps.
From an allocator's perspective, this reframes risk measurement. Evergreen vehicles may exhibit higher reported volatility than single-drawdown funds because capital remains continuously exposed to private asset returns rather than intermittently allocated to cash. However, this volatility reflects productive exposure rather than structural inefficiency. The relevant metric is not nominal volatility but the efficiency with which committed capital is transformed into invested capital and subsequently into compounded capital.
The broader macro implication is that evergreen capital is no longer marginal within global wealth.
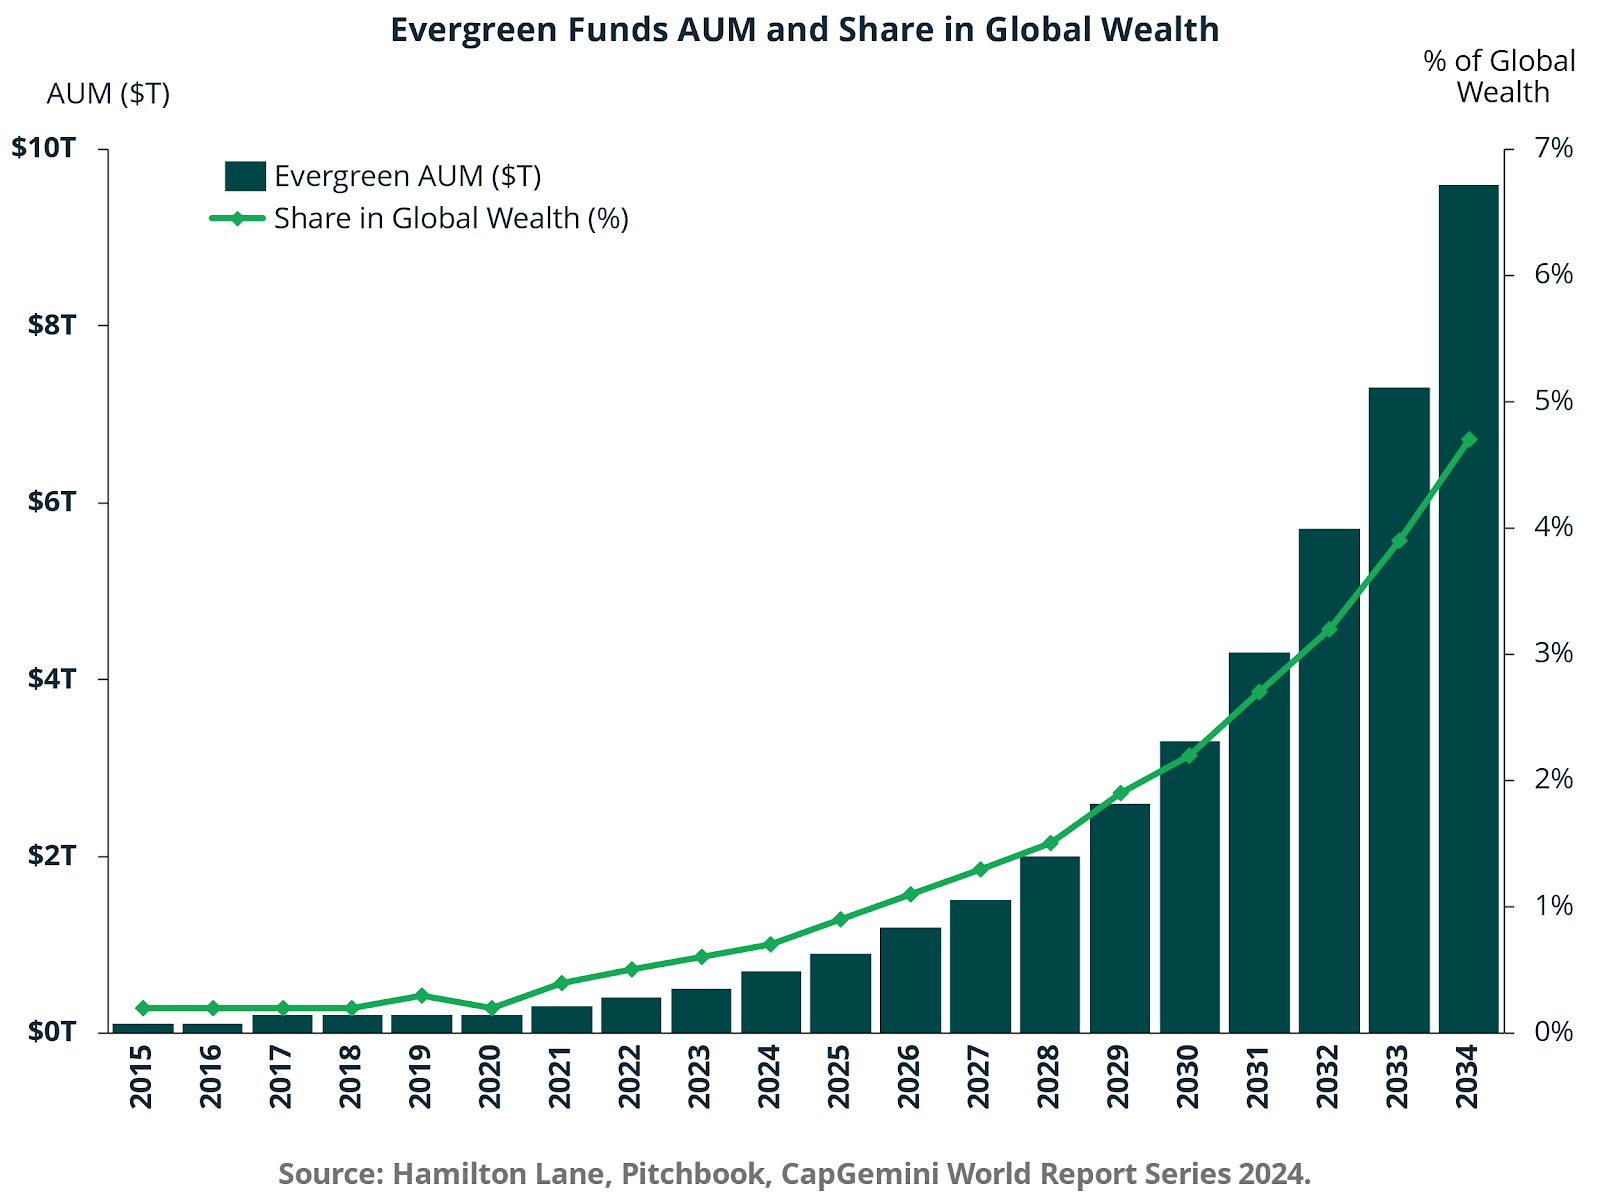
Global evergreen AUM has expanded from a negligible base in 2015 to a projected multi-trillion-dollar asset class by 2034, with the share of global wealth rising toward the mid single-digit percentage range. The increasing penetration into wealth portfolios reflects improved alignment between product design and investor behavior. Continuous subscription and periodic liquidity features compress the temporal gap between capital intent and capital deployment, making the private markets structurally more compatible with advisor-driven channels.
Interval and Tender Offer Funds
Within the evergreen ecosystem, interval and tender offer funds have emerged as dominant semi-liquid wrappers optimized for private credit, secondaries, and diversified private capital strategies. Their appeal lies in a calibrated liquidity regime that balances periodic redemptions with underlying asset illiquidity.
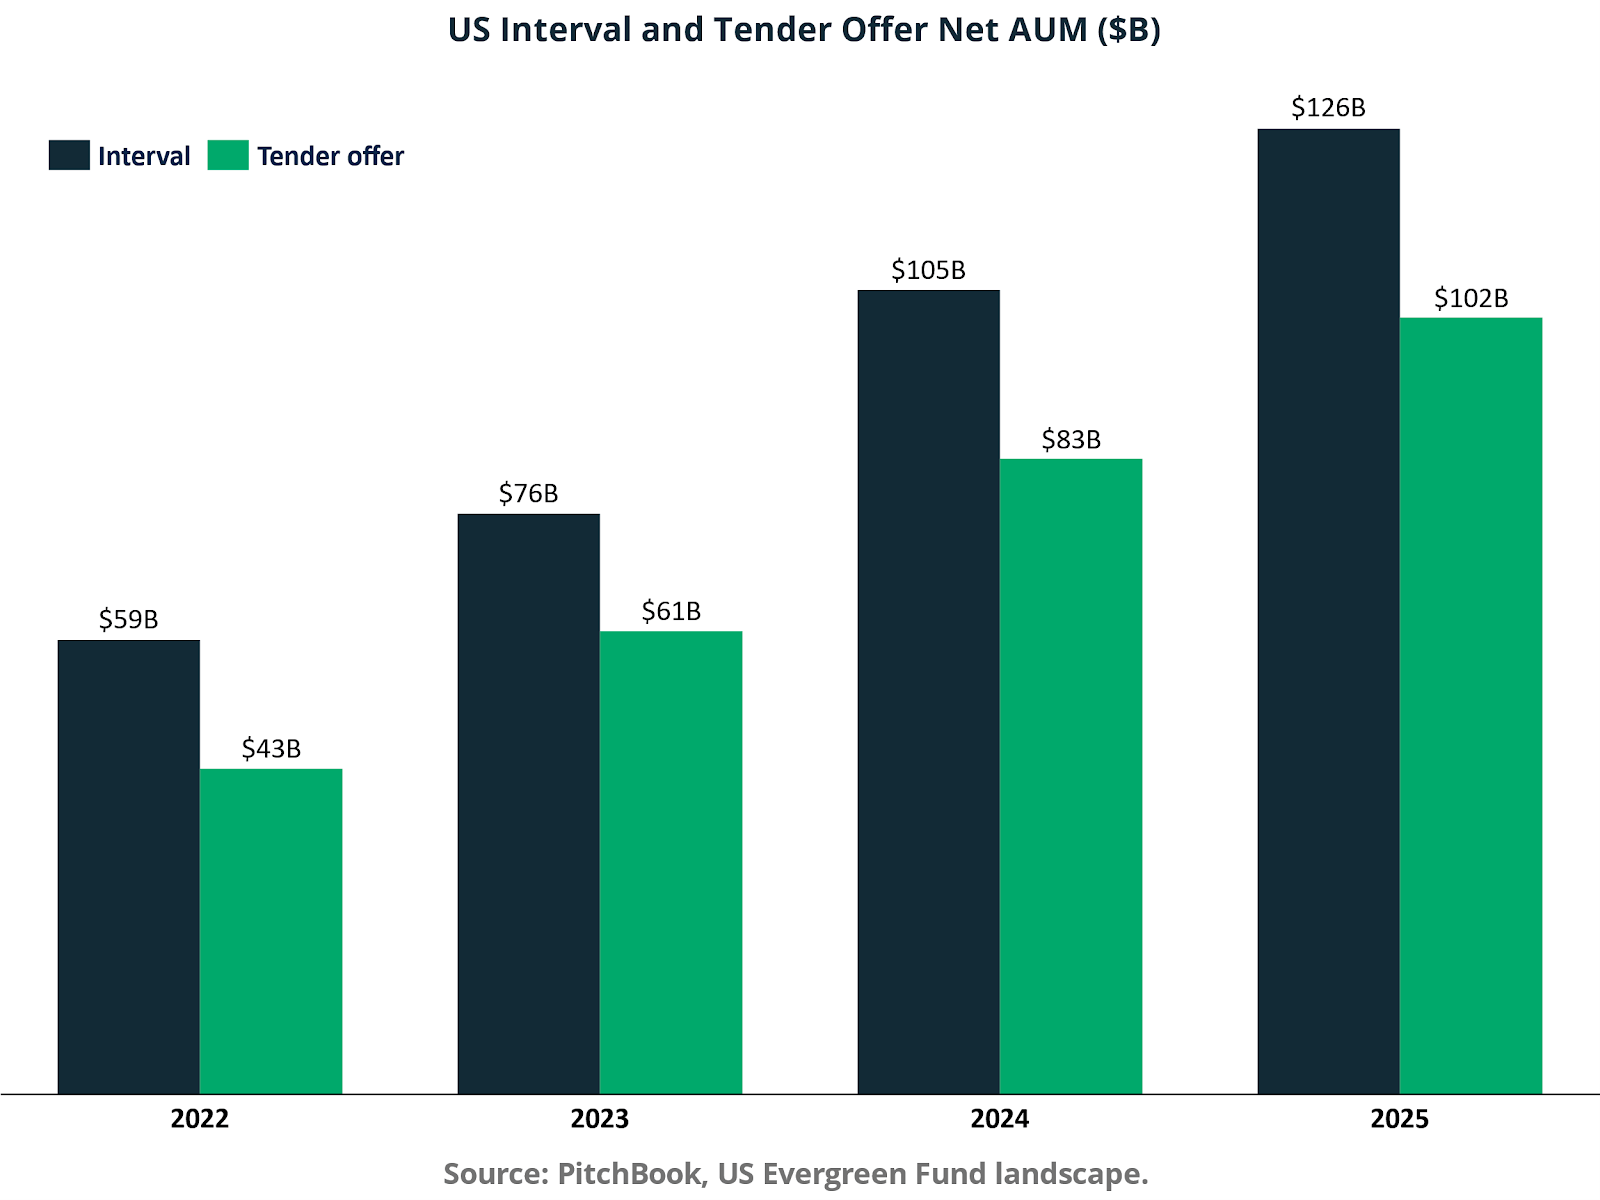
Interval fund net AUM increased from $59 billion in 2022 to $126 billion in 2025. Tender offer funds expanded from $43 billion to $102 billion over the same period. Combined, these two formats now represent more than $225 billion in assets, accounting for a substantial share of total unlisted evergreen capital. The growth trajectory underscores strong distribution uptake, particularly within the wealth management channel, where quarterly or semi-annual liquidity windows provide a psychologically and operationally acceptable compromise between daily liquidity and long lockups.
Structurally, interval and tender offer funds mitigate liquidity mismatch through redemption caps and board discretion. Typically offering repurchase windows for 5 to 25% of outstanding shares per period, these vehicles embed liquidity management into the fund design rather than relying on secondary market exits. The capital structure, therefore, resembles a controlled liquidity sleeve layered over a largely illiquid asset portfolio. From a risk management standpoint, the sustainability of these formats depends on disciplined portfolio construction, conservative leverage, and careful pacing of inflows relative to deployment capacity.
The scaling of interval and tender offer vehicles also reflects distribution economics. Continuous capital allows GPs to smooth fee revenue, reduce vintage cyclicality, and deepen relationships with distribution partners. For wealth platforms, these vehicles enable private market exposure without the administrative burden of capital calls and irregular distributions.
In aggregate, the data indicate that evergreen, interval, and tender offer structures are not transient innovations. They represent a structural convergence between private market return generation and public market capital accessibility. The central economic proposition is improved compounding efficiency through capital continuity, with liquidity engineered rather than assumed.
Performance and Risk: Return Evidence Inside Evergreen Structures
The cleanest way to isolate the value of structure is to hold asset-level assumptions constant and vary only the capital deployment path. Simulation results show that a single drawdown fund produces a 6.5% mean annual return, not because the underlying assets are structurally weaker, but because capital is chronically underinvested. On average, only 28.7% of committed capital is deployed, leaving the remainder as implicit cash drag. That deployment shortfall also compresses systematic exposure, with a mean beta of 0.31, which is inconsistent with how allocators typically underwrite private market risk premia.
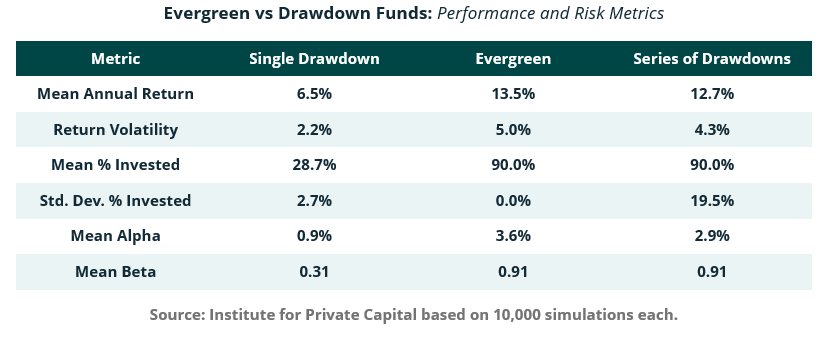
Evergreen structures materially change capital efficiency equation. When capital is managed for continuity, the average invested fraction rises to 90%, and the mean beta increases to 0.91, matching the risk posture of a rolling series of drawdown funds that is engineered to remain fully invested. Despite equivalent average exposure, the evergreen structure still generates a higher mean annual return of 13.5% versus 12.7% for the drawdown series. The differentiating variable is exposure stability. The evergreen fund exhibits zero volatility in percent invested, while the drawdown series experiences 19.5% volatility in the invested fraction. In compounding terms, volatility around the target allocation introduces geometric drag, reducing realized return even when average exposure is identical. This is visible in the estimated alpha differential, with mean alpha of 3.6% for evergreen structures versus 2.9% for a drawdown series and 0.9 % for a single drawdown fund. The implication is that a meaningful portion of what appears as outperformance can be structurally explained by reinvestment efficiency rather than manager selection.
The return and volatility trade off reinforces the same conclusion. Evergreen funds deliver a mean annual return of 13.5% versus 6.5% for a single drawdown fund, effectively a doubling of return potential that is dominated by capital utilization rather than asset quality. Reported volatility rises from 2.2% to 5.0% because the evergreen structure maintains continuous exposure to private asset returns rather than intermittently holding cash. From a finance perspective, this is not an adverse outcome. It is the mechanical consequence of actually being invested and therefore harvesting the intended return stream.
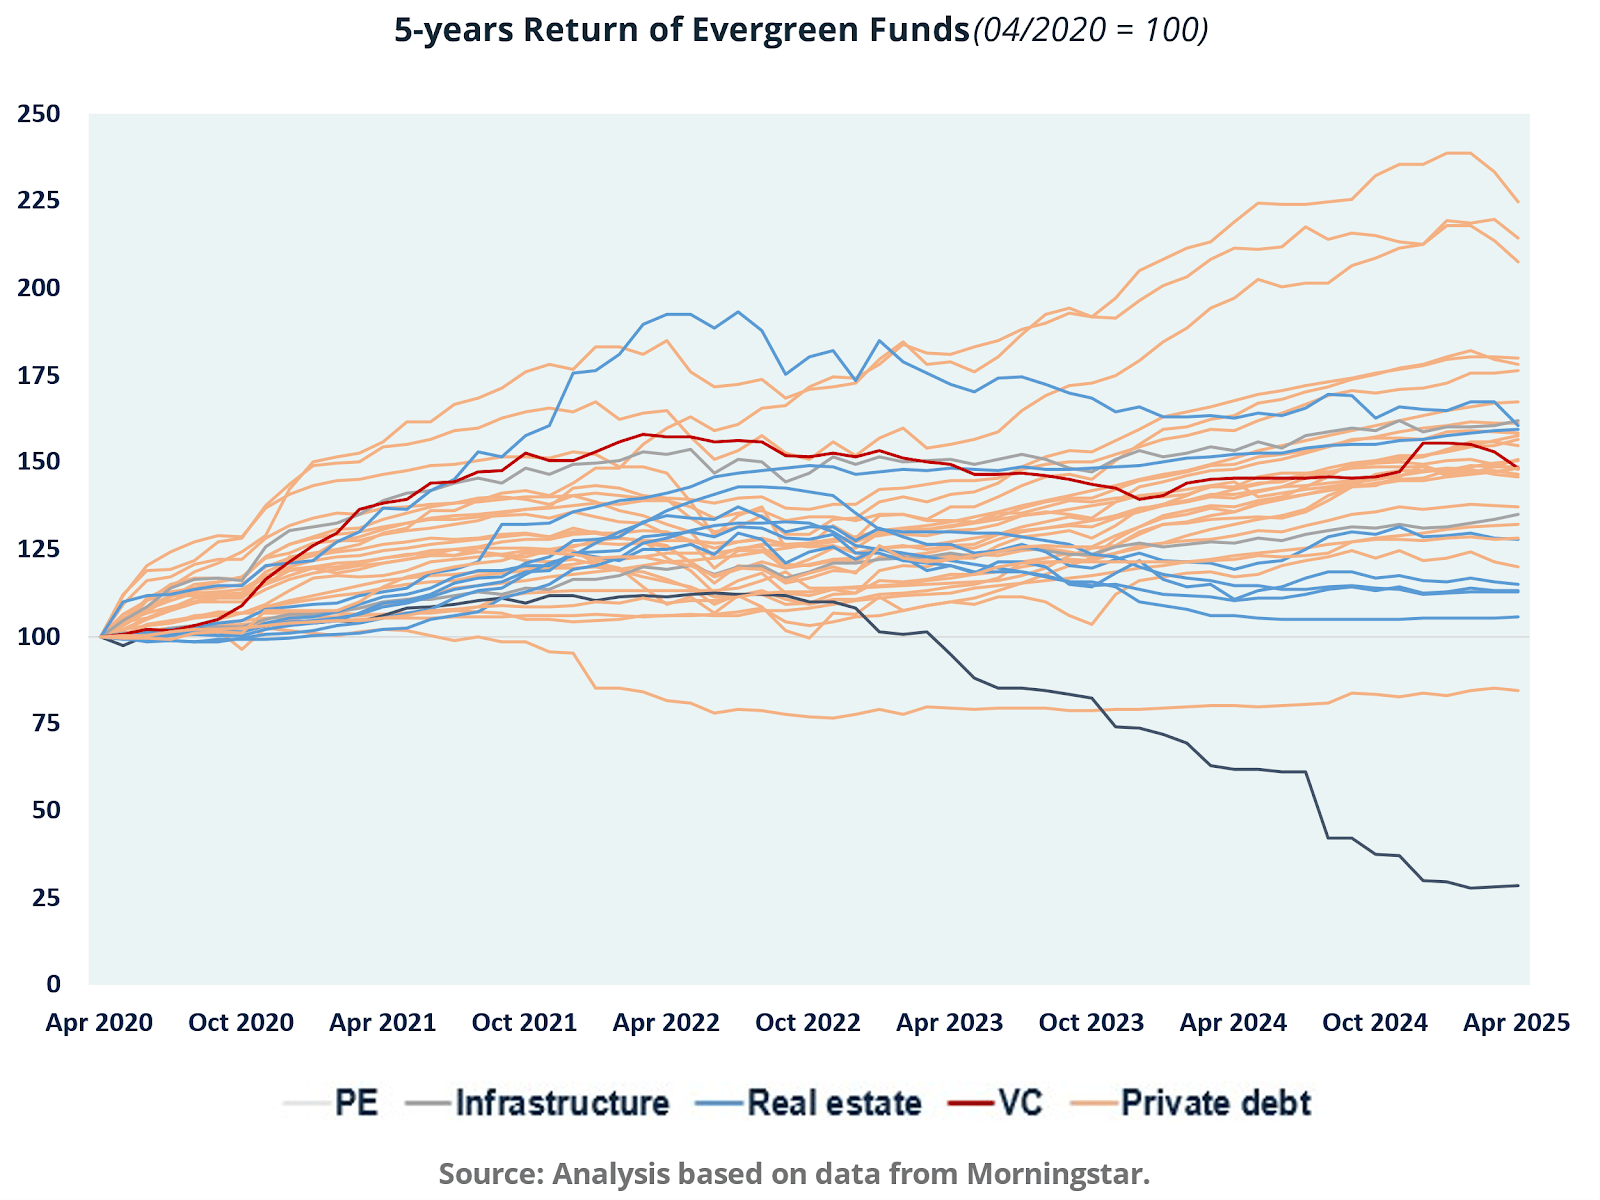
At the strategy level, the distribution of outcomes across evergreen vehicles confirms that the wrapper is not the asset class. Five year indexed performance since April 2020 shows dispersion across underlying categories, with private debt and secondaries generally exhibiting steadier accretion profiles than more cyclically sensitive exposures such as real estate. The cross sectional spread is consistent with differences in cash flow predictability, deployment speed, and dependence on exit markets, all of which influence how well an evergreen vehicle can maintain a stable invested fraction without compromising liquidity policy.
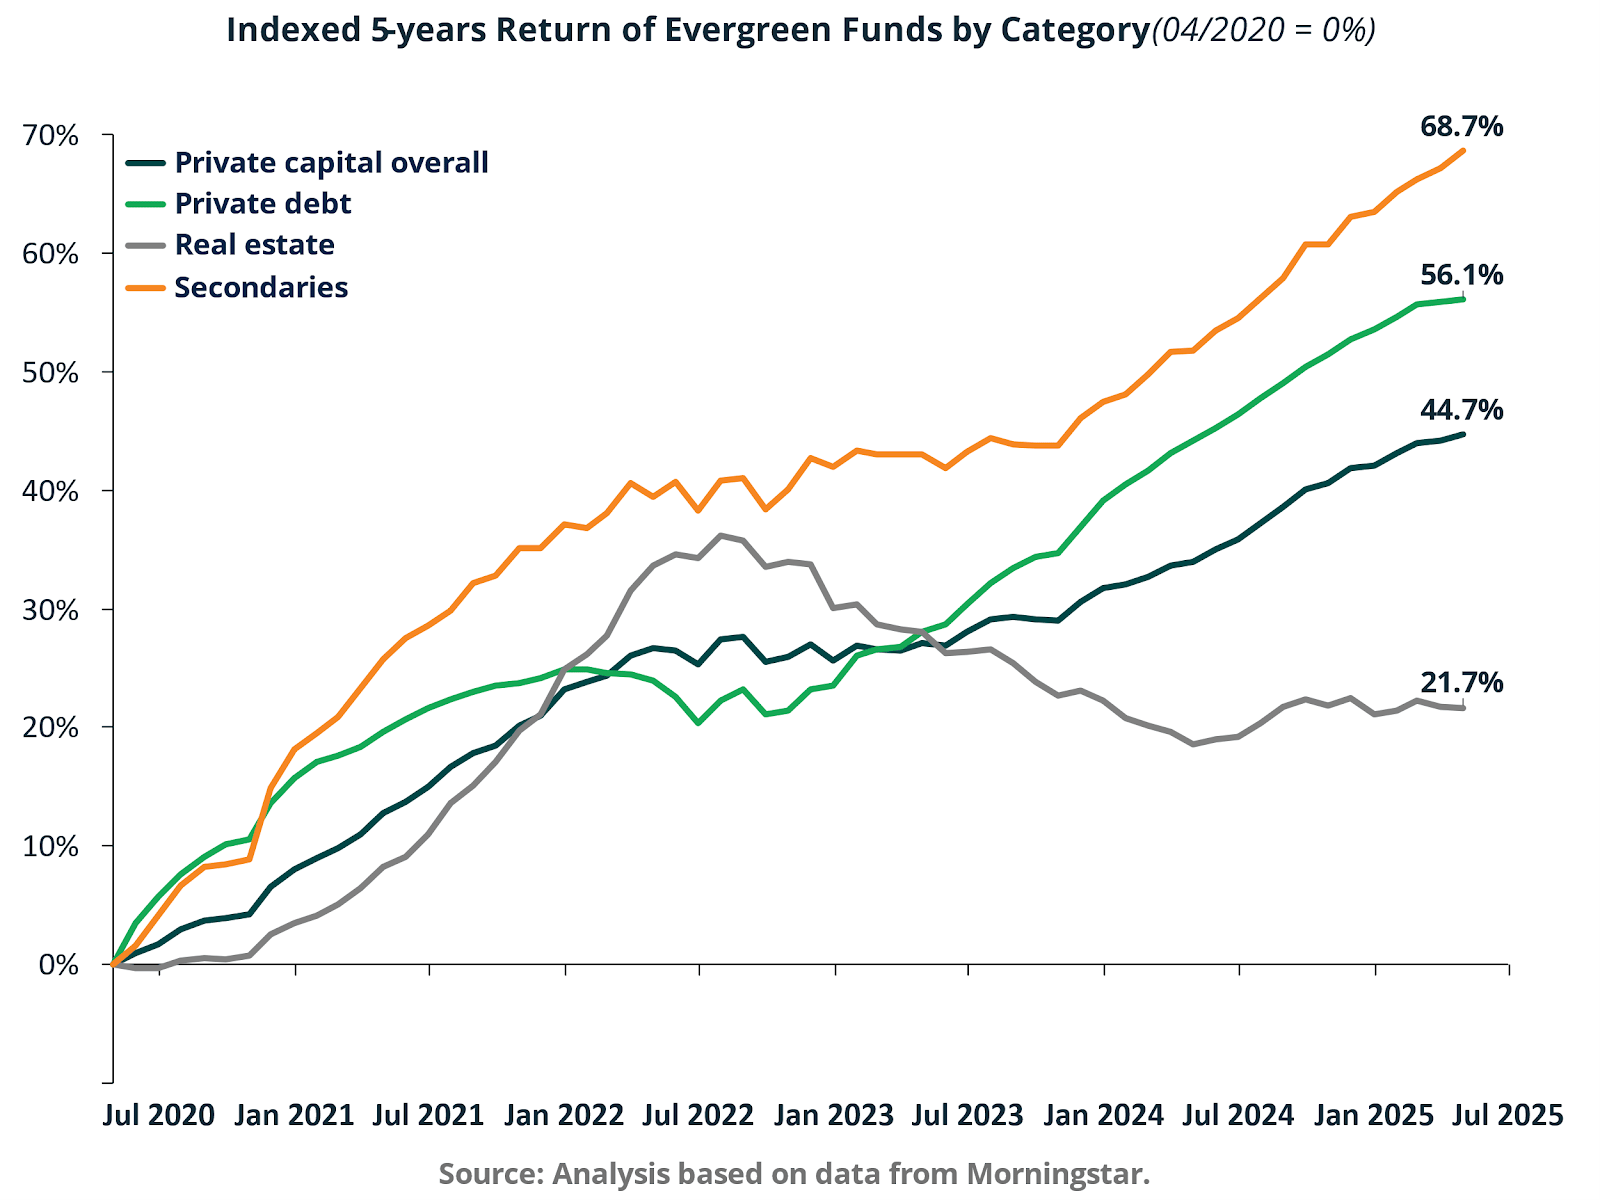
Aggregating by category clarifies which strategies have been most structurally compatible with evergreen mechanics in the post 2020 regime. From April 2020 through mid 2025, secondaries lead with approximately 68.7% cumulative growth, followed by private debt at 56.1%, private capital overall at 44.7%, and real estate at 21.7%.
This ordering is economically intuitive in an environment characterized by higher interest rates, constrained exit markets, and elevated dispersion in asset quality. Strategies with contractual cash flows, shorter duration, and clearer reinvestment capacity translate continuous capital into more reliable compounding.
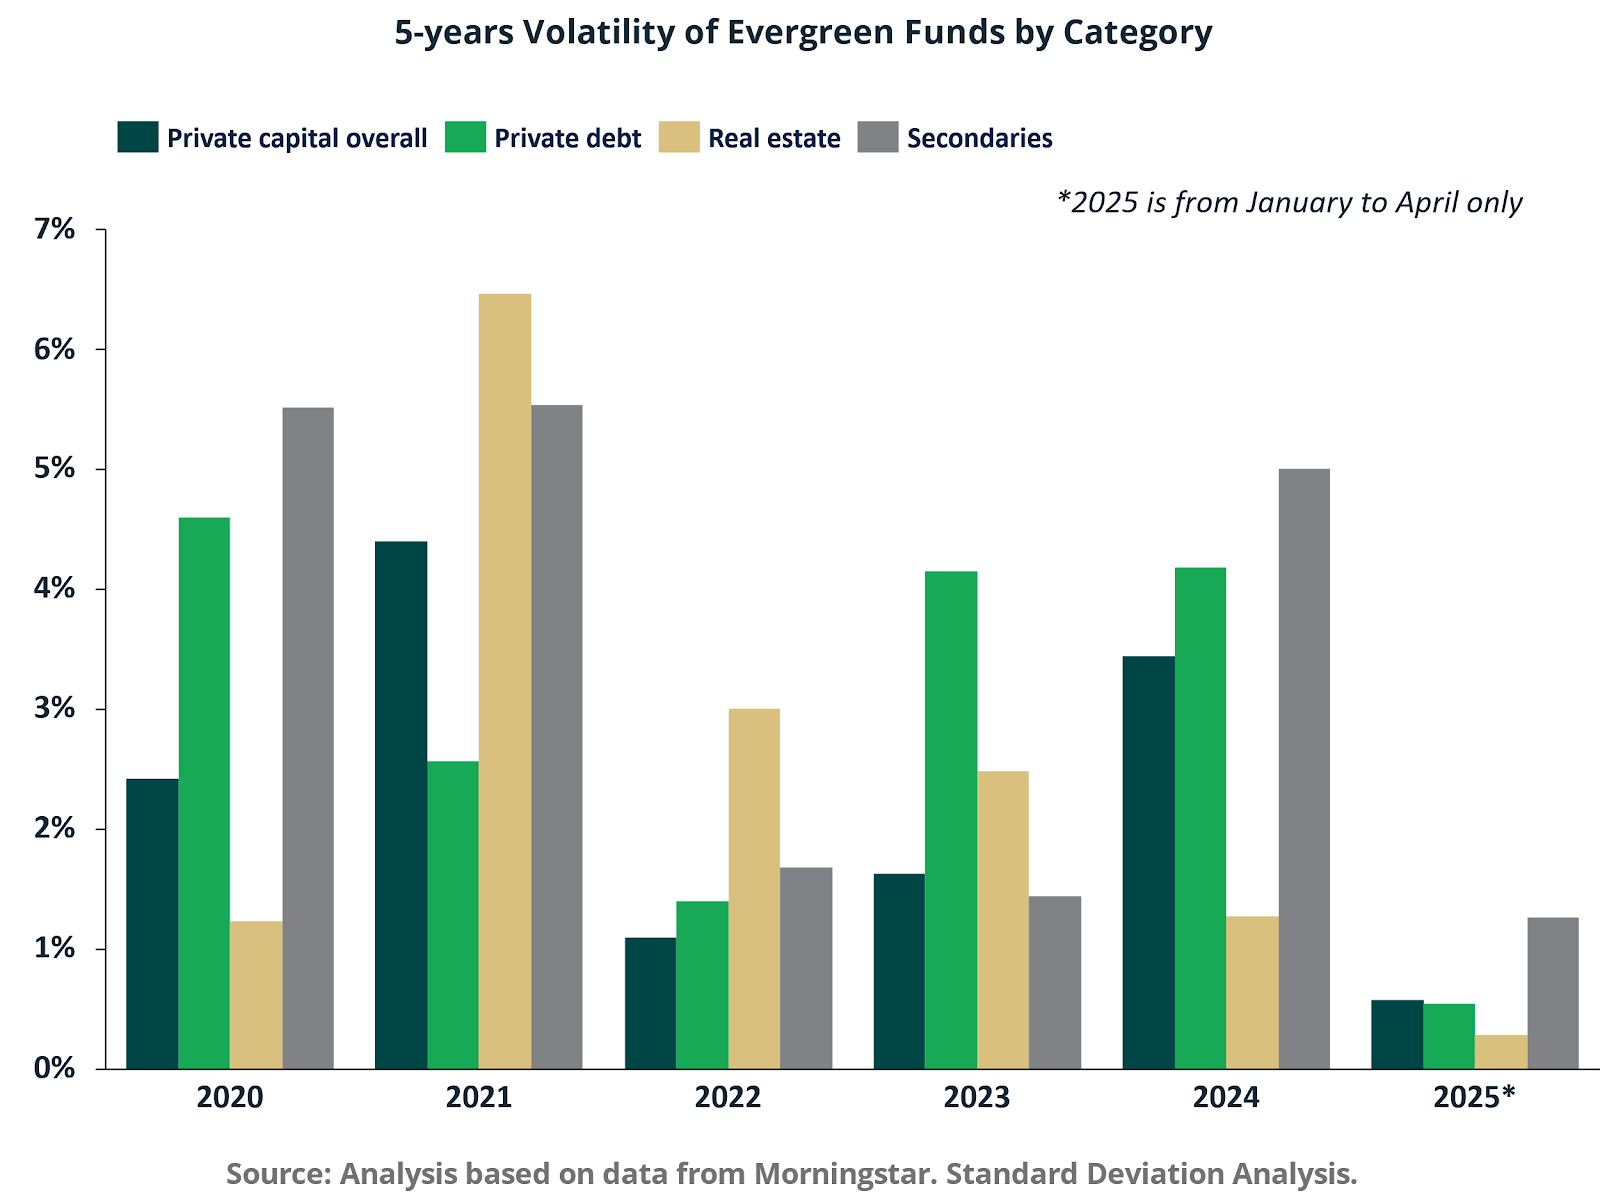
Volatility data adds necessary nuance. Reported volatility varies meaningfully across categories and across time, reflecting both underlying economic conditions and the smoothing effects of NAV based valuation. In 2021, real estate volatility peaks near 6.5%, while volatility compresses across categories in 2022, consistent with valuation lag during a period of market stress.
By 2024, dispersion reemerges, with secondaries near 5.0% and private debt near 4.2%, while real estate remains closer to the low 1% range.
This pattern suggests that reported stability can reflect appraisal processes as much as underlying economic stability, particularly for real estate.
For allocators, the practical takeaway is that evergreen performance should be evaluated through a capital efficiency lens. Higher volatility in an evergreen structure can be the natural result of being continuously invested and therefore economically engaged with the return generating engine. The more decision relevant questions are whether the vehicle can sustain a high invested fraction, whether liquidity terms and portfolio liquidity sleeves are internally consistent, and whether valuation governance is sufficiently robust to prevent volatility from being hidden rather than managed.
Expert’s Opinion:
The following perspective was shared by our Subject Matter Expert, Jason Haft, Director, Private Equity Sales:
"We are witnessing a structural shift in private capital as the traditional 10-12 year closed-end model is increasingly supplemented by evergreen and semi-liquid structures. This evolution is largely driven by the 'democratization' of the asset class, with retail and private wealth channels demanding the same institutional-grade exposure but with more flexible entry and exit points. Data is tricky to come by for the specifics of how this is impacting new launches, but we would estimate roughly 20% of new structures we see follow the evergreen model.
This push for tangible returns has accelerated the scale and complexity of the secondary market, which is no longer just a tactical 'release valve' but a strategic pillar. As investors proactively seek their own liquidity options, the rise of sophisticated continuation vehicles and LP-led transactions has transformed the secondaries space into a primary engine for portfolio rebalancing and capital recycling.
In our ongoing dialogue with potential clients, the 'language' of success is also evolving. While IRR and MOIC remain the bedrock of performance evaluation, DPI has moved from a secondary consideration to a primary mandate. In a market where paper gains no longer suffice, we are supporting our clients as they pivot toward this cash-on-cash reality."
III. The Rise of Continuation Funds
Continuation funds have moved from a niche secondary solution to a core instrument in private equity capital management. Structurally, they sit between traditional drawdown funds and fully evergreen vehicles. While not open-ended in a subscription and redemption sense, they operationalize the same economic objective: extending the compounding horizon by separating asset duration from fund duration.
In a continuation transaction, assets are transferred from a legacy fund into a newly capitalized vehicle managed by the same sponsor. Existing limited partners are offered optionality to cash out, roll over, or partially reinvest, while new investors provide fresh capital. What would otherwise have been a terminal exit becomes an internal reinvestment decision.
The growth trajectory is now visible in both transaction volume and exit share.
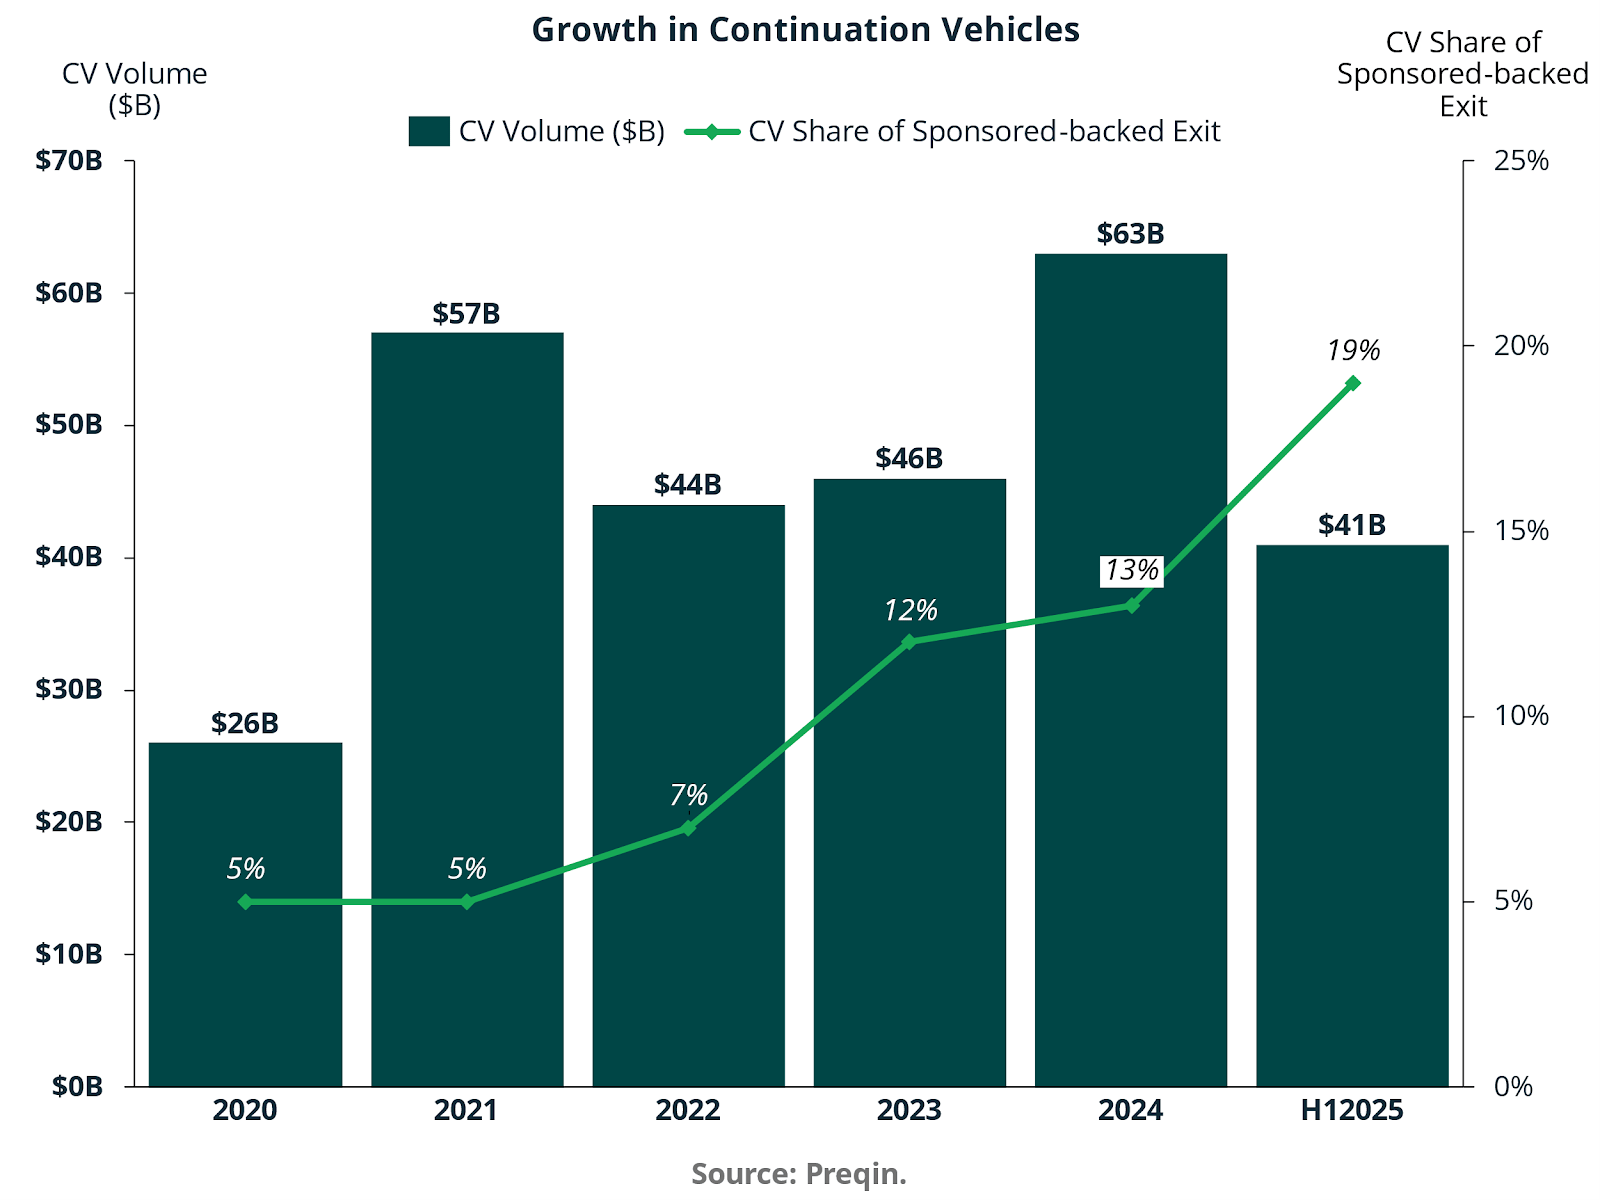
Continuation vehicle volume increased from $26 billion in 2020 to $57 billion in 2021, moderated to $44 billion in 2022, then rebounded to $63 billion in 2024. Even in the first half of 2025, volume has already reached $41 billion, suggesting another strong full year outcome. More striking than absolute dollars is the structural penetration into exit activity. Continuation vehicles accounted for approximately 5% of sponsor backed exits in 2020 and 2021, rising to 7% in 2022, 12% in 2023, 13% in 2024, and reaching 19% in the first half of 2025. In other words, nearly one in five sponsor backed exits now occurs through an internal continuation structure rather than a traditional third-party sale.
This expansion is directly linked to constrained IPO and M & A markets. In 2023, continuation transactions represented roughly nine to ten percent of total private equity distributions to limited partners, up from approximately five percent in 2022. Faced with muted public market liquidity and selective strategic buyers, sponsors increasingly turned to GP led secondaries as an endogenous liquidity mechanism.
Capital Raised and Proliferation
The institutionalization of the product is also evident in capital formation and fund count.
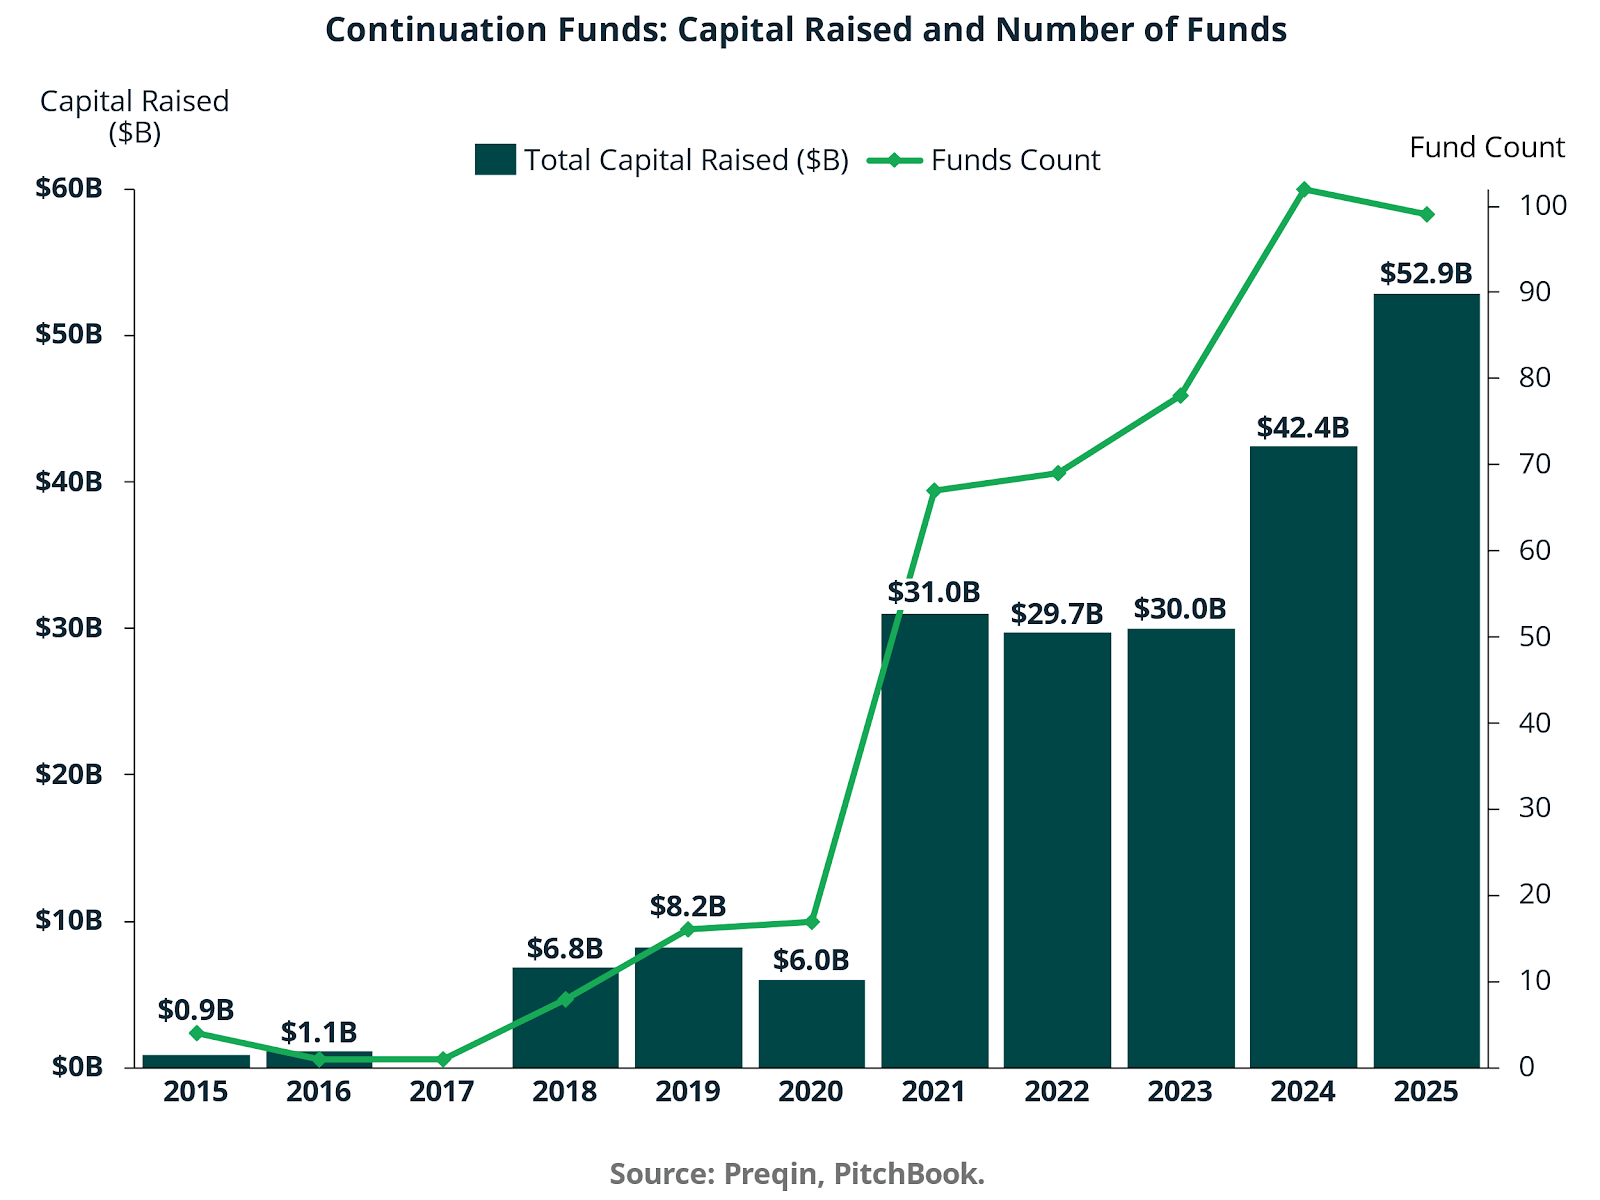
Capital raised in continuation vehicles grew from less than $1 billion in 2015 to $31.0 billion in 2021. Despite a softer exit environment, activity remained elevated at $29.7 billion in 2022 and $30.0 billion in 2023, before accelerating to $42.4 billion in 2024 and $52.9 billion in 2025. Fund count expanded in parallel, rising sharply after 2020 and reaching roughly 100 vehicles by 2024 and 2025. This is no longer episodic deal making. It is a structurally scaled segment of the secondary market.
Continuation vehicles now dominate GP led secondaries activity. Across single asset and multi asset formats, they account for the majority of transactions in this channel. This reflects a shift from portfolio level liquidity solutions toward asset specific underwriting.
Transaction Structure and Governance
The mechanics of a typical continuation transaction illustrate both its elegance and its tension.
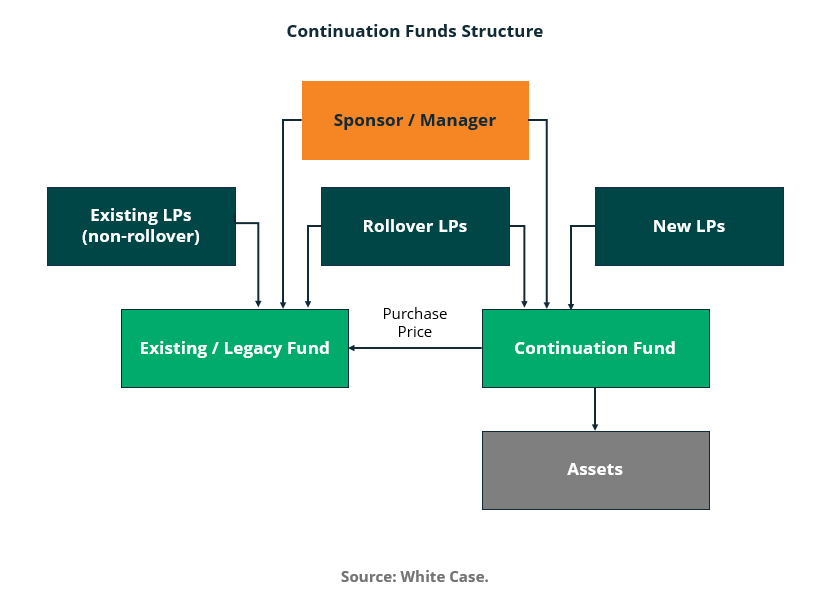
The sponsor manages both the legacy fund and the continuation vehicle. Existing limited partners who do not roll over receive cash at the negotiated purchase price. Rollover investors and new limited partners capitalize the continuation vehicle, which acquires the asset from the legacy fund. Economically, this resets the holding period and often renegotiates management fees, carry structures, and governance terms.
The structure introduces inherent conflicts of interest because the sponsor effectively sits on both sides of the transaction. Pricing discipline, independent valuation, competitive auction processes, and transparent disclosure are therefore critical to mitigating the perception and risk of self dealing. Most sophisticated buyers now require third party fairness opinions and competitive secondary processes to cleanse this structural tension.
Capital Continuity and Extended Compounding
The economic logic behind continuation funds is best understood through the lens of capital continuity.
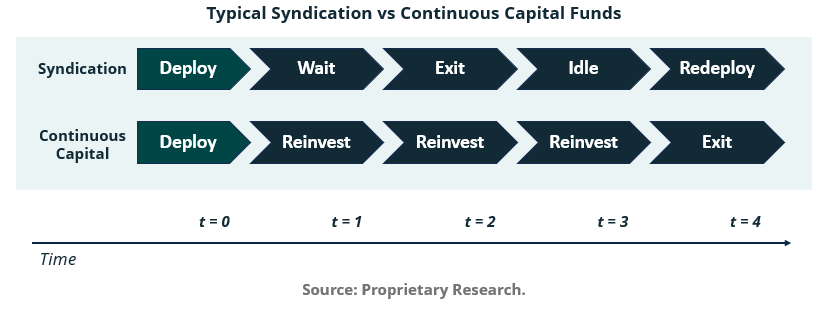
Traditional syndication follows a deploy, wait, exit, idle, redeploy sequence. Capital exits the return stream upon realization and remains idle until the next opportunity. Drawdown funds mitigate this through portfolio construction, but still generate discontinuities as distributions recycle back to limited partners.
Continuation funds partially internalize reinvestment. By transferring selected assets into a new vehicle, they allow compounding to continue under GP control rather than forcing an exit at the expiration of a ten year fund life. While compounding occurs only for the selected assets, the economic effect is to reduce reinvestment timing risk for rollover investors.
This distinction becomes clearer when comparing compounding mechanics across structures.
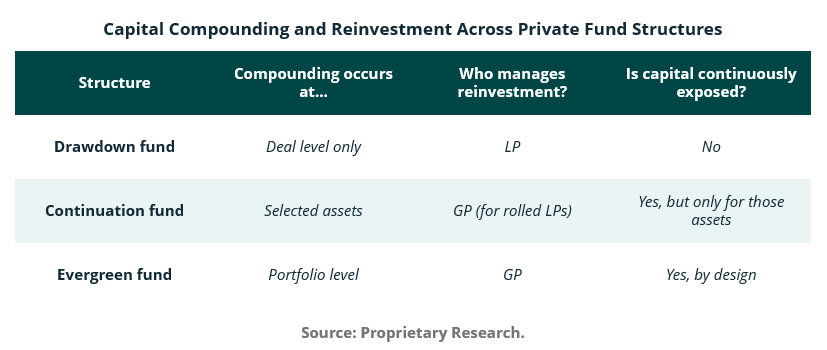
In a drawdown fund, compounding occurs at the individual deal level and reinvestment decisions are effectively externalized to limited partners. In a continuation vehicle, compounding is extended for selected assets and managed by the GP for those who roll. In an evergreen structure, compounding occurs at the portfolio level by design.
The key insight is that asset level alpha and capital path alpha are separable. Even with identical underlying asset performance, volatility in invested capital and reinvestment gaps can reduce geometric returns. Continuation vehicles reduce this capital path dispersion for targeted assets.
Asset Type and Deployment Mix
Continuation funds are not homogeneous. Transaction composition reveals investor preference for control and cash flow visibility.
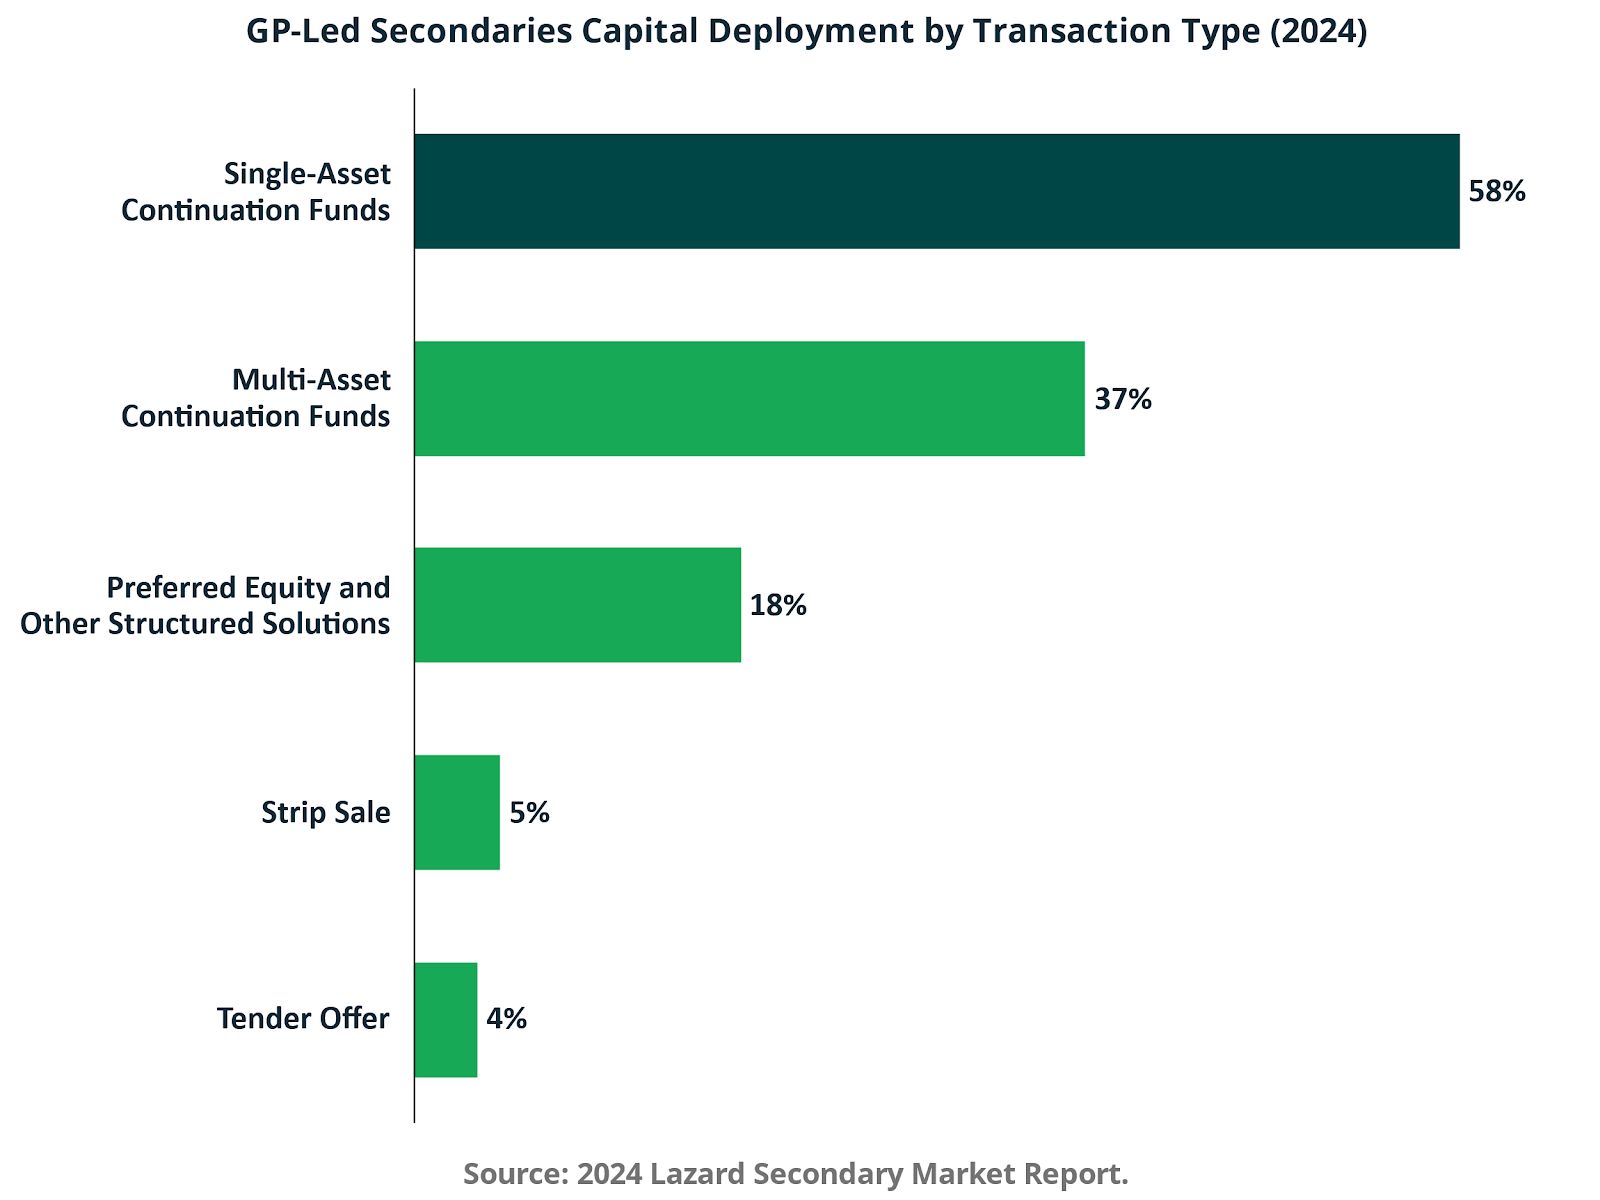
In 2024, single asset continuation funds represented 58% of GP-led secondary deployment, while multi-asset continuation vehicles accounted for 37%. Preferred equity and other structured solutions represented 18%, with strip sales and tender offers representing only 5% and 4%, respectively. The dominance of single-asset structures reflects a preference for concentrated underwriting of mature, high-conviction businesses with known management teams and established cash flow profiles.
Buyout strategies remain the core driver of continuation activity, although venture, infrastructure, and private credit are increasingly participating as valuation stability returns and exit windows gradually reopen.
Performance Evidence
Performance data, while still developing given the post-2018 acceleration in deal volume, suggests continuation vehicles are not structurally inferior to traditional buyouts.
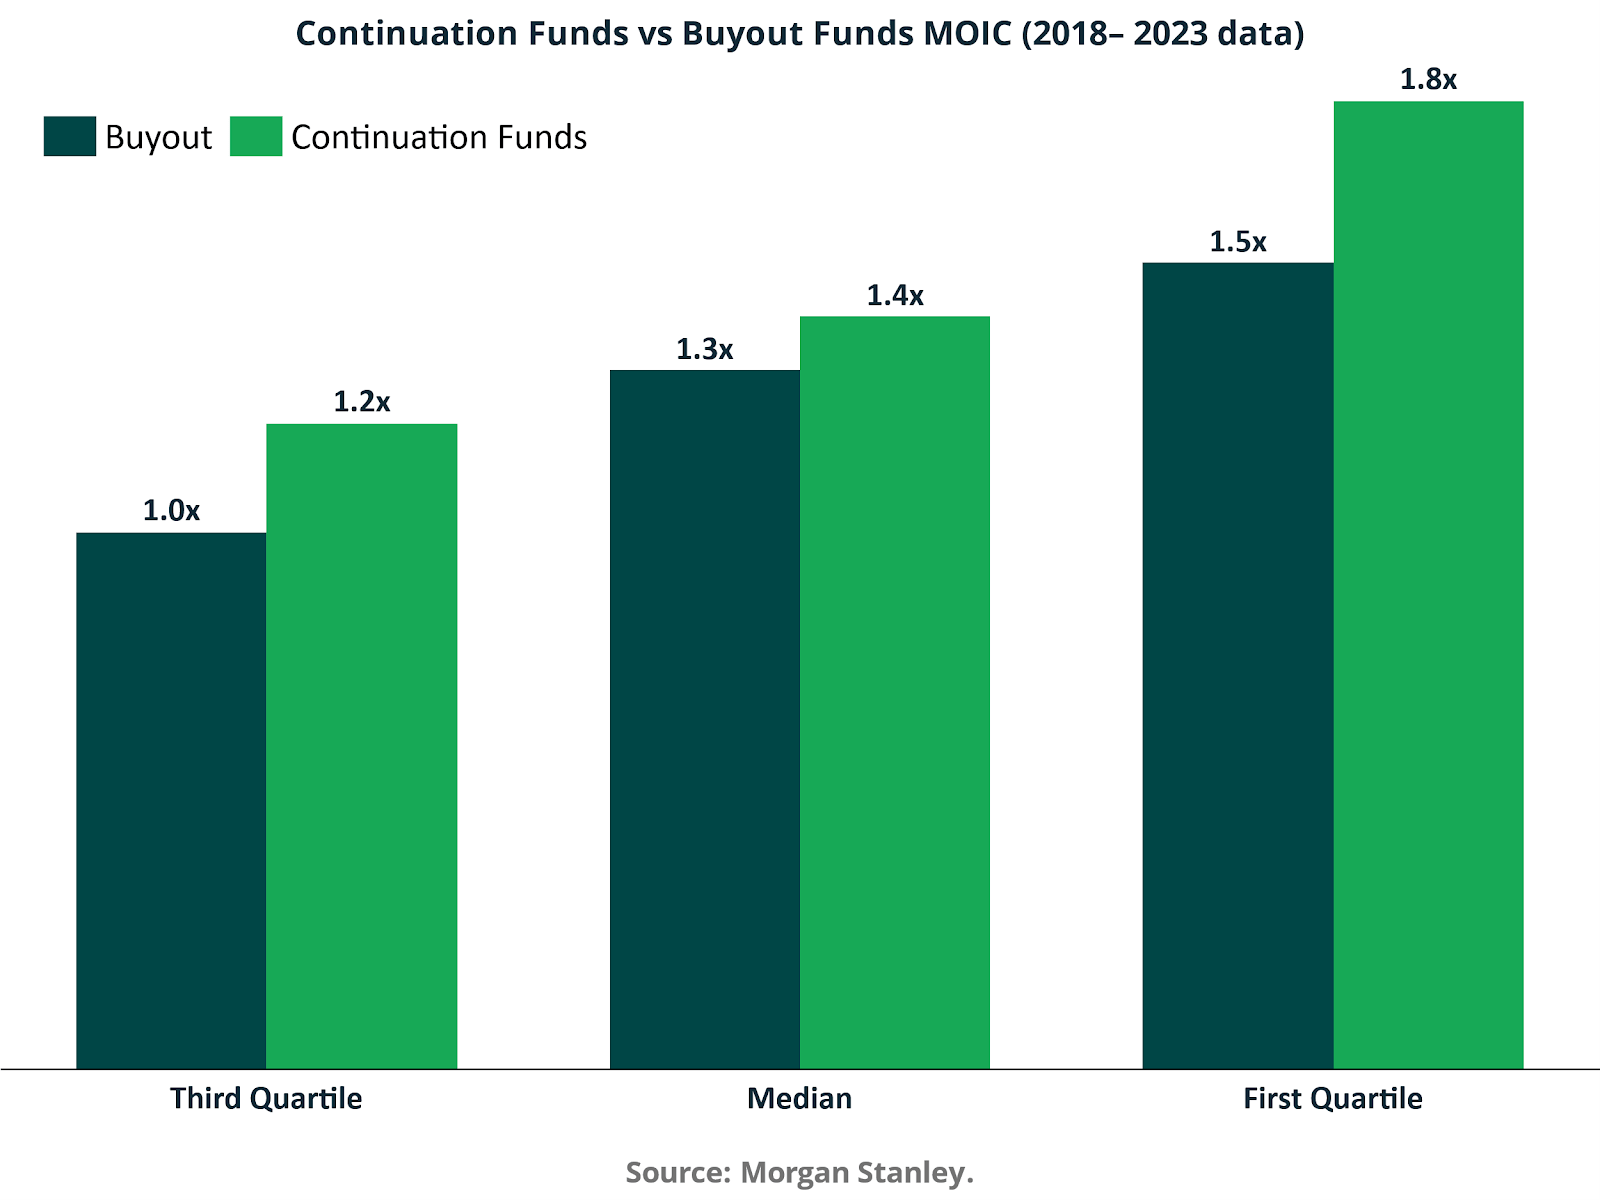
Across vintages from 2018 to 2023, continuation funds outperformed buyout funds across all quartiles on a MOIC basis. Third quartile MOIC was approximately 1.2x for continuation vehicles versus 1.0x for buyouts. Median MOIC was 1.4x versus 1.3x. The first-quartile MOIC was 1.8x, compared with 1.5x for buyouts. While dispersion remains meaningful, early evidence indicates that concentrated exposure to known assets can produce attractive risk-adjusted outcomes.
More than 90% of buyers target net returns above 2.0x MOIC and approximately 20% IRR for single-asset continuation vehicles, with slightly lower thresholds for multi-asset transactions. This underwriting discipline reflects the premium pricing often associated with trophy assets and the need for rigorous due diligence at the company and sponsor level.
Strategic and Ethical Implications
The rise of continuation funds reflects both structural market constraints and sponsor strategy. With sponsor-to-sponsor exits accounting for nearly 30% of buyout-backed activity in recent years, continuation vehicles provide an alternative that allows sponsors to retain upside rather than ceding future gains to rivals. They also allow firms to manage time more deliberately, avoiding forced exits when valuation multiples are temporarily compressed.
However, ethical considerations remain central. Because the sponsor controls both the selling and buying vehicles, governance rigor determines whether extended compounding accrues to investors or disproportionately benefits the manager through reset fee streams and carry crystallization. Alignment mechanisms such as rolling 100% of crystallized carry, meaningful GP co-investment, and offering status quo options to existing LPs have become market standards.
Ultimately, continuation funds are best understood as a structural response to a structurally challenged exit environment. They are neither inherently problematic nor inherently superior. Their economic value derives from capital continuity and extended compounding. Their legitimacy derives from transparency, independent pricing validation, and disciplined underwriting. As long as exit markets remain uneven and private equity portfolios retain significant unrealized value, continuation vehicles are likely to remain a durable component of the private markets toolkit.
Engineering Liquidity in an Exit Bottleneck
The rise of continuation vehicles is not primarily a story of financial innovation. It is a response to a structural liquidity bottleneck created by slower exits, extended holding periods, and mounting LP pressure for distributions. In effect, continuation funds have become the industry’s mechanism for reconciling three competing forces: aging assets, constrained traditional exit routes, and the need to generate DPI.
The Exit Bottleneck: A Market That Has Not Fully Reopened
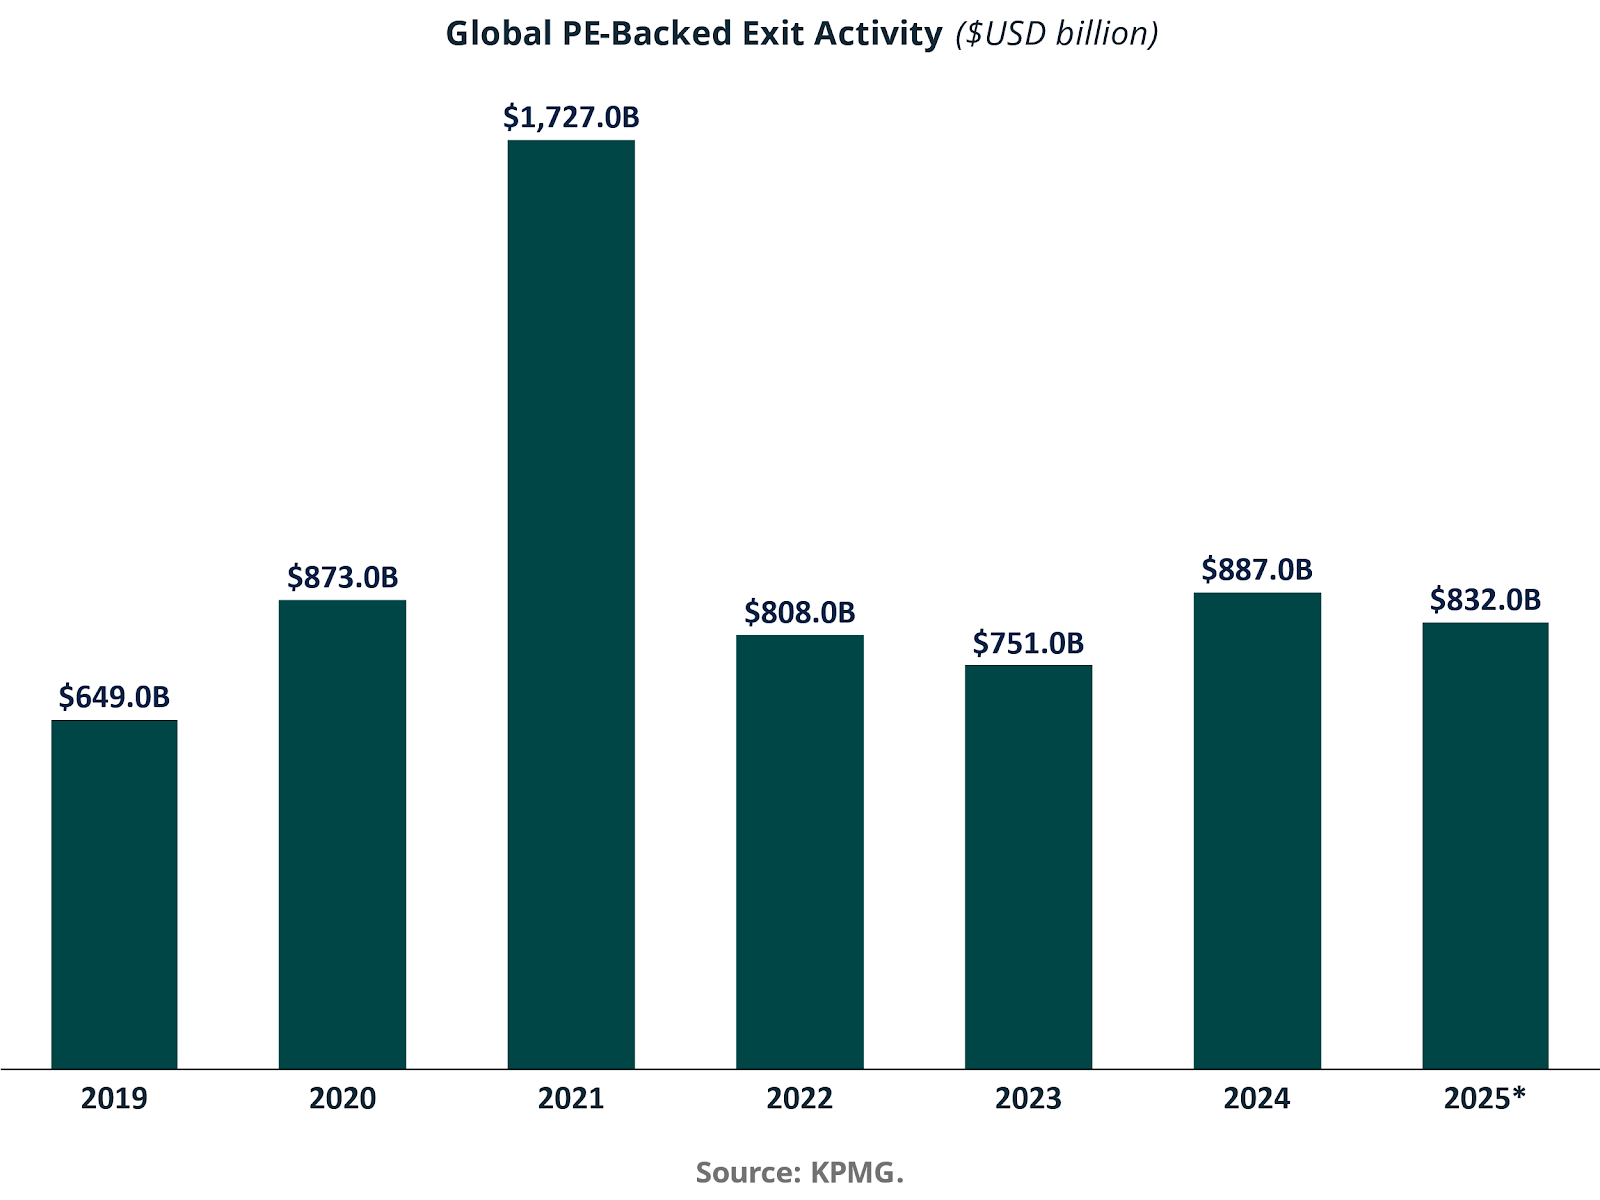
Global PE-backed exit activity illustrates the magnitude of the dislocation. Exit value peaked at $1,727 billion in 2021, then declined sharply to $808 billion in 2022 and $751 billion in 2023. Although 2024 recovered to $887 billion and 2025 is projected at $832 billion, the market remains roughly half the size of the 2021 peak.
This contraction has created a backlog of mature portfolio companies. Assets underwritten in 2018 to 2020 at elevated multiples have encountered a repricing environment shaped by higher discount rates and tighter financing conditions. As a result, sponsors face a valuation gap between buyer underwriting models and seller return targets.
In this context, continuation vehicles offer a third path. Rather than selling at a perceived cyclical trough or holding indefinitely within a closed-end fund approaching term, GPs can transfer high-quality assets into a new vehicle, providing liquidity to existing LPs while retaining exposure to future upside.
LP Pressure and the Cash Flow Constraint
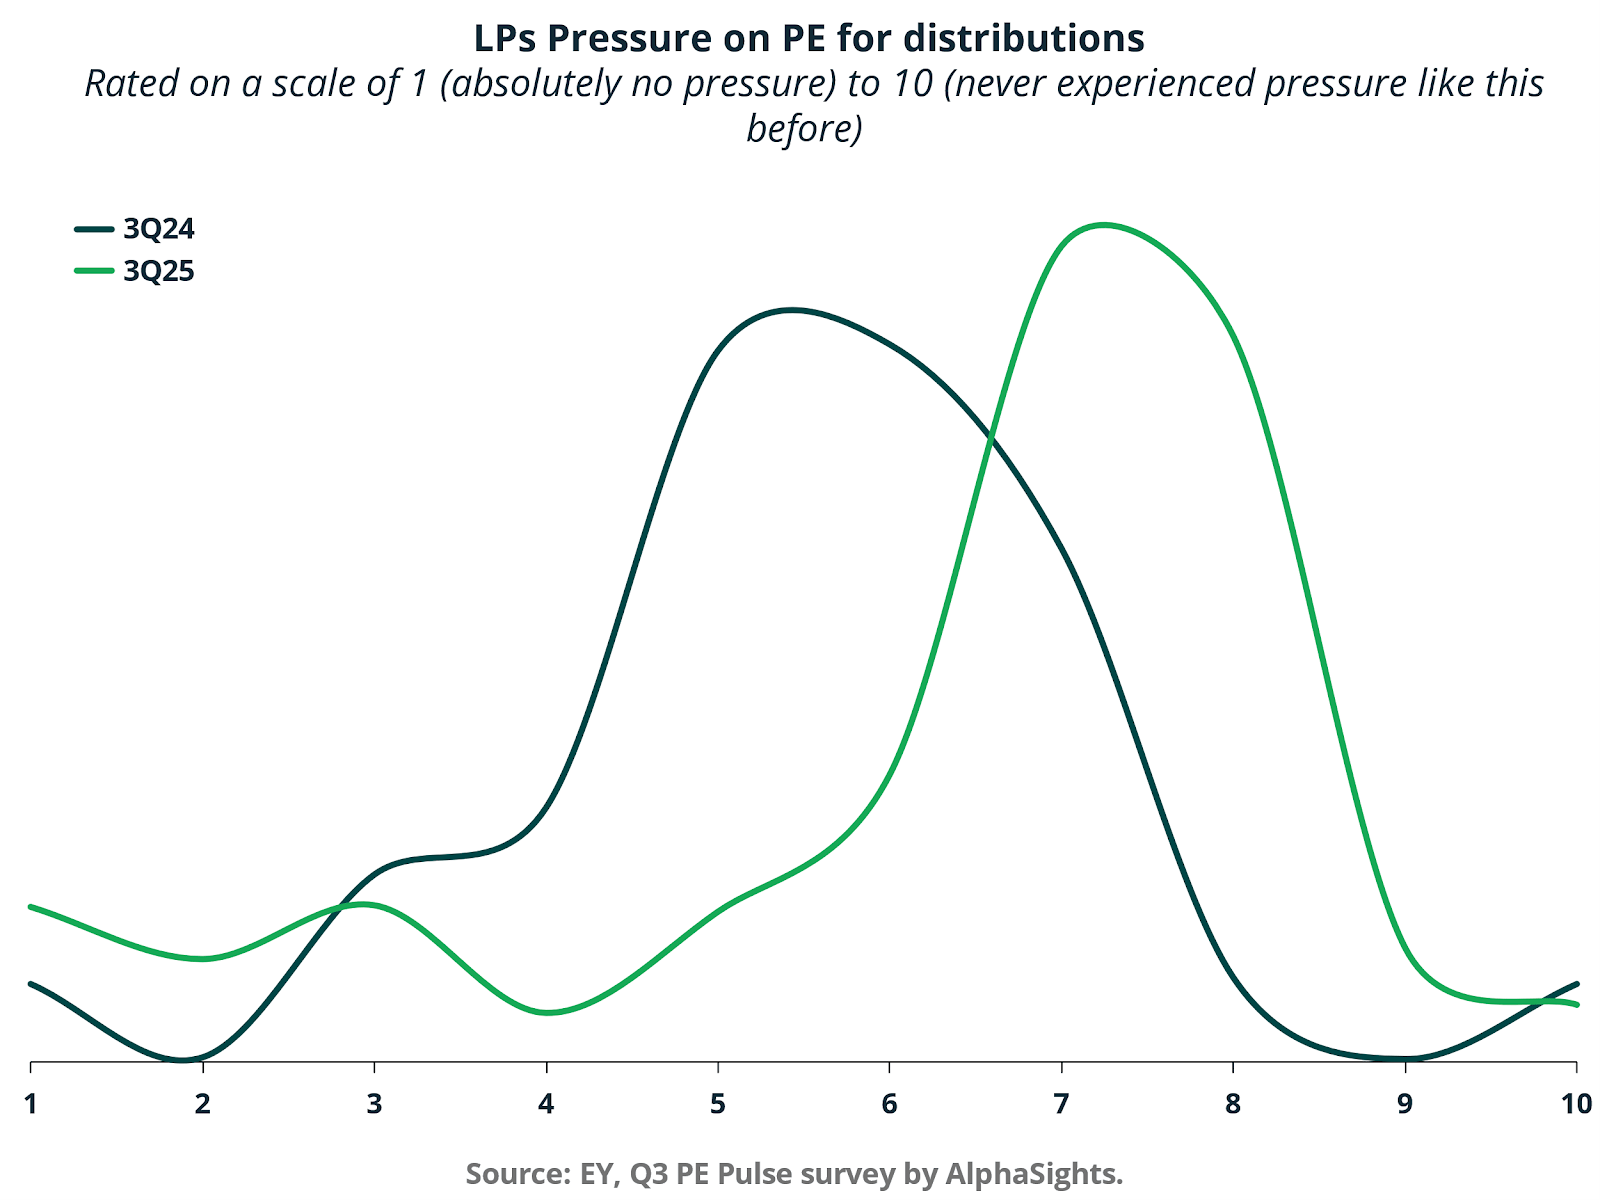
The liquidity tension is clearly visible in LP sentiment. Survey data from EY shows a meaningful rightward shift in perceived pressure between 3Q24 and 3Q25, with more respondents clustering in the six to eight range on a ten-point scale. This indicates elevated expectations for distributions compared to the prior year.
The denominator effect, muted distributions, and rising allocation targets in alternative strategies have intensified the need for cash returns. Even with exit volumes recovering, the level of realizations has not fully matched the capital deployed during the 2020 and 2021 surge. This mismatch has left many LPs capital-constrained and eager to recycle commitments into new vintages.
Continuation vehicles directly address this cash flow problem. They allow LPs to elect liquidity at a market-clearing price or roll into a new structure. For GPs, they provide a mechanism to generate DPI without forcing a full trade sale or IPO in a volatile environment.
Exit Routes Constrained, Alternatives Gaining Traction
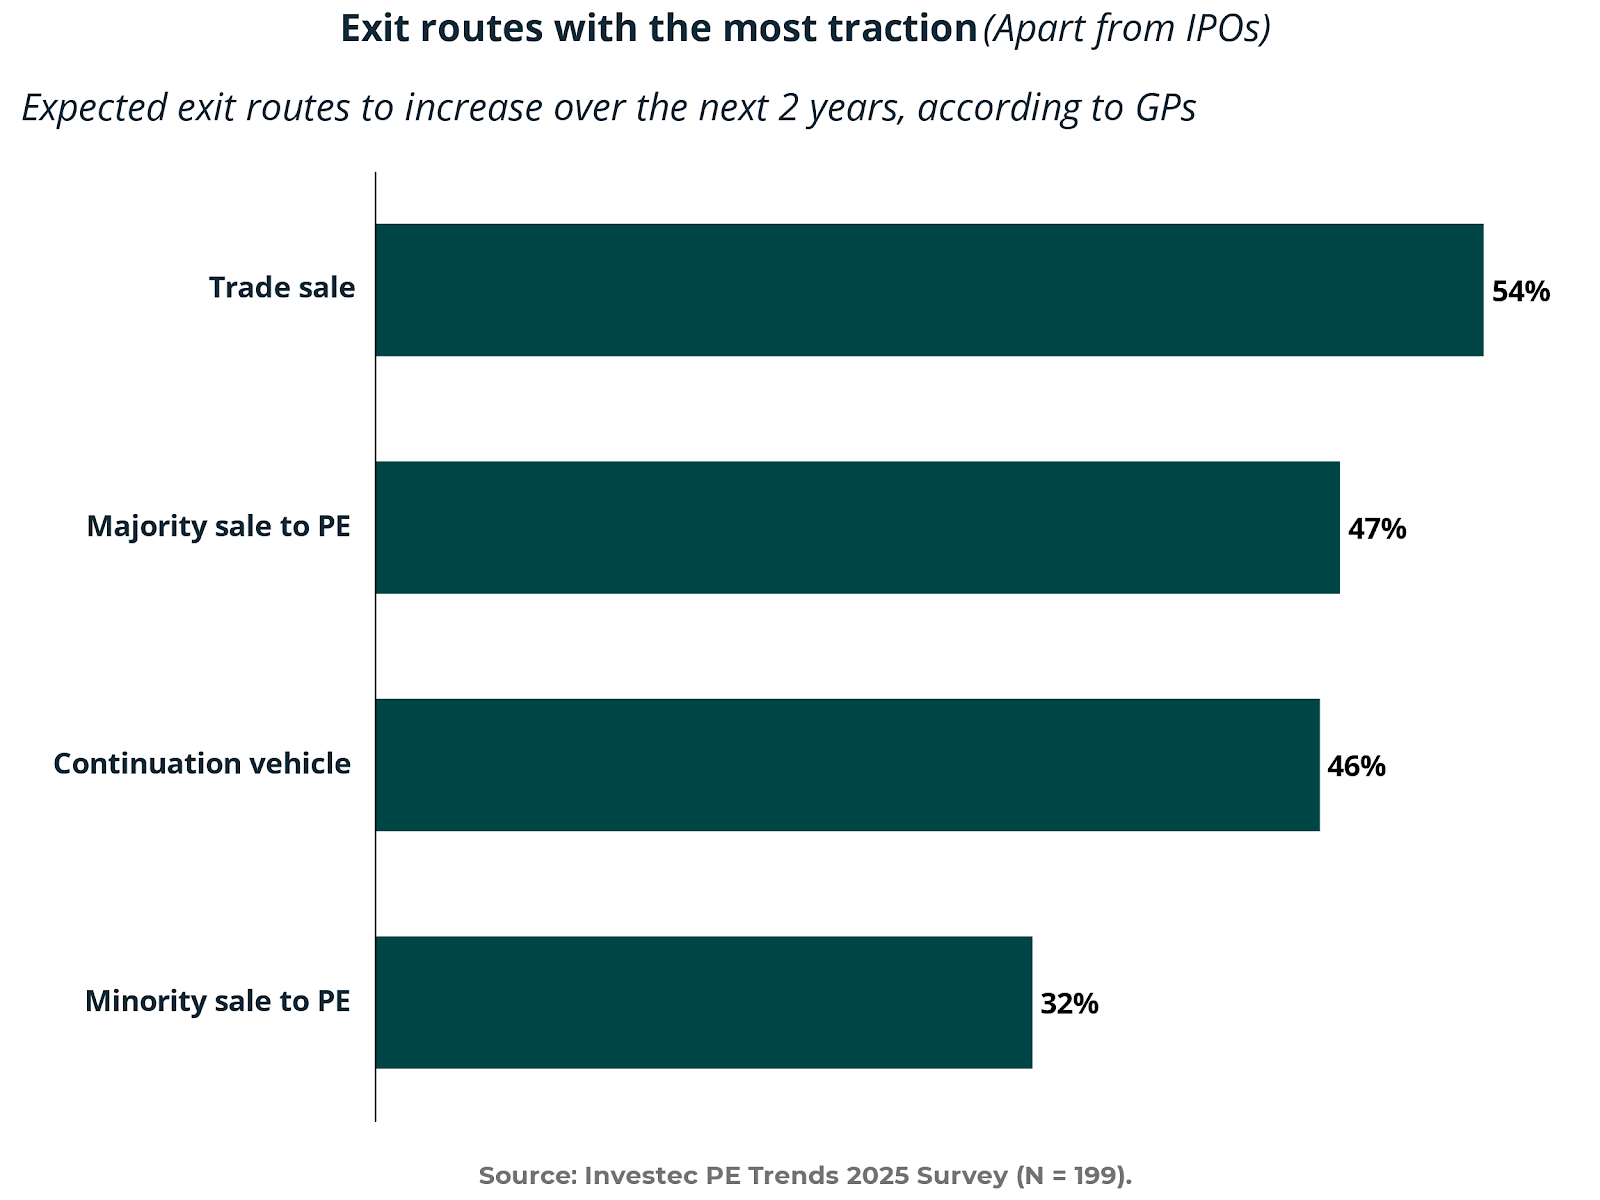
Expected exit routes over the next two years underscore the limited menu of options. Trade sales lead at 54%, followed by majority sponsor-to-sponsor sales at 47% and continuation vehicles at 46%. Minority sales to PE trail at 32%.
The near parity between majority sales and continuation vehicles is telling. Continuation funds are no longer a marginal tool; they are approaching mainstream status as an alternative to traditional secondary buyouts.
In an environment where IPO windows remain selective and strategic buyers are disciplined on price, GP-led transactions provide flexibility and timing control.
This reflects a broader structural shift. Exits are no longer binary events. They are increasingly staged, structured, and negotiated across multiple layers of capital.
Liquidity Needs Outpacing Secondary Capital
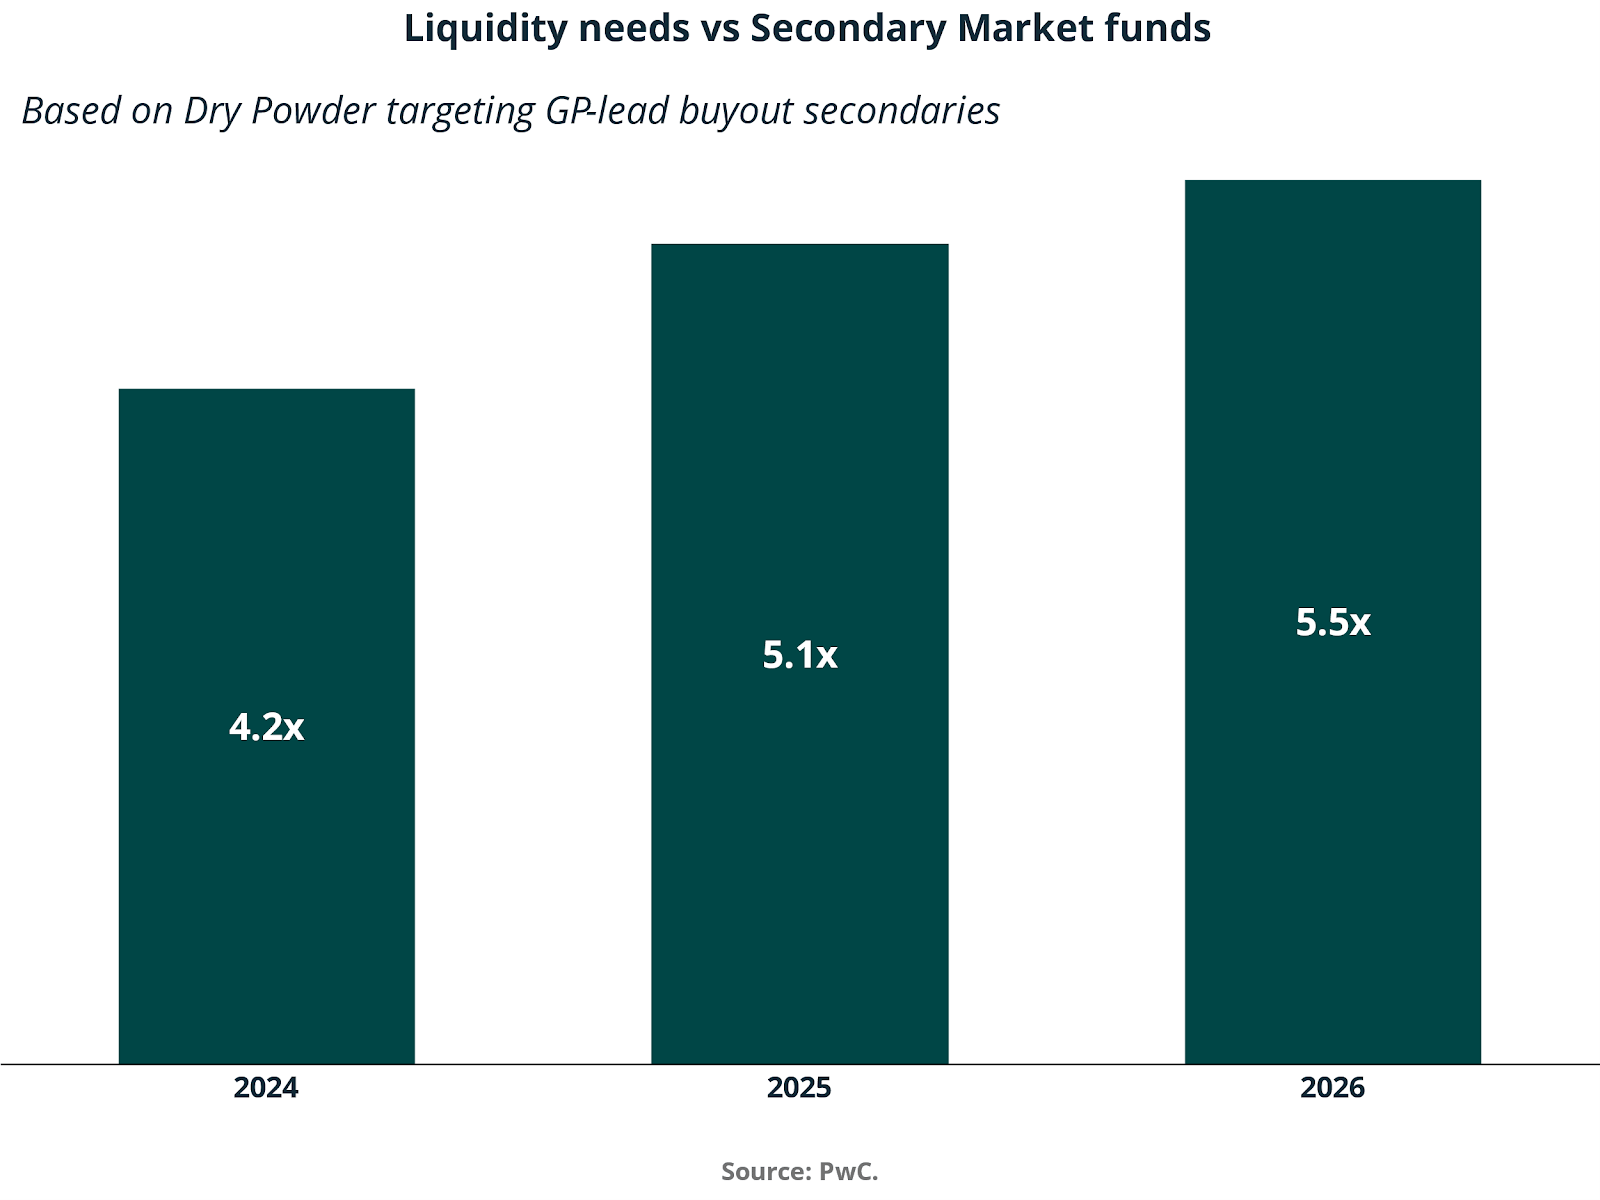
While secondaries' dry powder has grown, liquidity needs continue to outstrip available capital. The ratio of liquidity demand to GP-led buyout secondary capital rises from 4.2x in 2024 to 5.1x in 2025 and 5.5x in 2026.
This widening gap highlights two realities. First, the scale of aging assets seeking solutions is substantial. Second, continuation vehicles are becoming a structural release valve, but not a complete one. Supply of GP-led opportunities exceeds dedicated capital, reinforcing the need for disciplined pricing, credible governance, and alignment.
For GPs, this creates both opportunity and scrutiny. Only assets with demonstrable operational momentum and defensible cash flow profiles are likely to attract rollover support and new capital. The era of using continuation vehicles to warehouse underperforming assets is fading as LP diligence intensifies.
Longer Holding Periods as the Structural Driver
At the core of the continuation trend lies the extension of holding periods. Assets that historically would have exited in four to five years are now frequently held six to seven years or longer. The six to seven year cohort represents the friction point in the market, where capital recycling slows and IRR pressure builds.
Higher financing costs have reduced leverage-driven IRR acceleration. Multiple expansion has become less reliable. As a result, value-creation timelines have lengthened, and sponsors are increasingly reliant on operational improvements and revenue growth rather than on financial engineering.
Continuation vehicles align with this reality. They recognize that certain high-quality assets may require additional time to fully realize strategic initiatives, bolt-on acquisitions, or technology-driven transformation. Rather than forcing an exit to satisfy fund timelines, sponsors can reset the ownership clock.
From Tactical Tool to Institutionalized Feature
What began as a tactical solution during periods of market stress is evolving into a structural feature of the private markets. As assets spend a larger portion of their lifecycle in private ownership, secondary trading and GP-led liquidity solutions are becoming embedded in the ecosystem.
The implication is clear. The rise of continuation vehicles is not simply a cyclical phenomenon tied to temporary exit weakness. It is a rational response to a private market architecture characterized by longer holds, larger funds, and more complex capital structures.
In a market where liquidity must increasingly be engineered rather than discovered, continuation vehicles have emerged as one of the defining products of the current cycle.
IV. How Bank Retrenchment creates tailwinds for private Credit
The Big Picture of Private Credit
Private credit operates through a vertically integrated capital channel that connects long-duration institutional capital to mid-market corporate borrowers. End investors such as pension funds, insurance corporations, sovereign wealth funds, and retail allocators deploy capital into a range of intermediaries, including closed-end funds, open-ended vehicles, business development companies, and CLO structures. These intermediaries originate primarily floating rate, covenant-intensive loans to small and medium-sized corporates, often with limited access to syndicated markets.
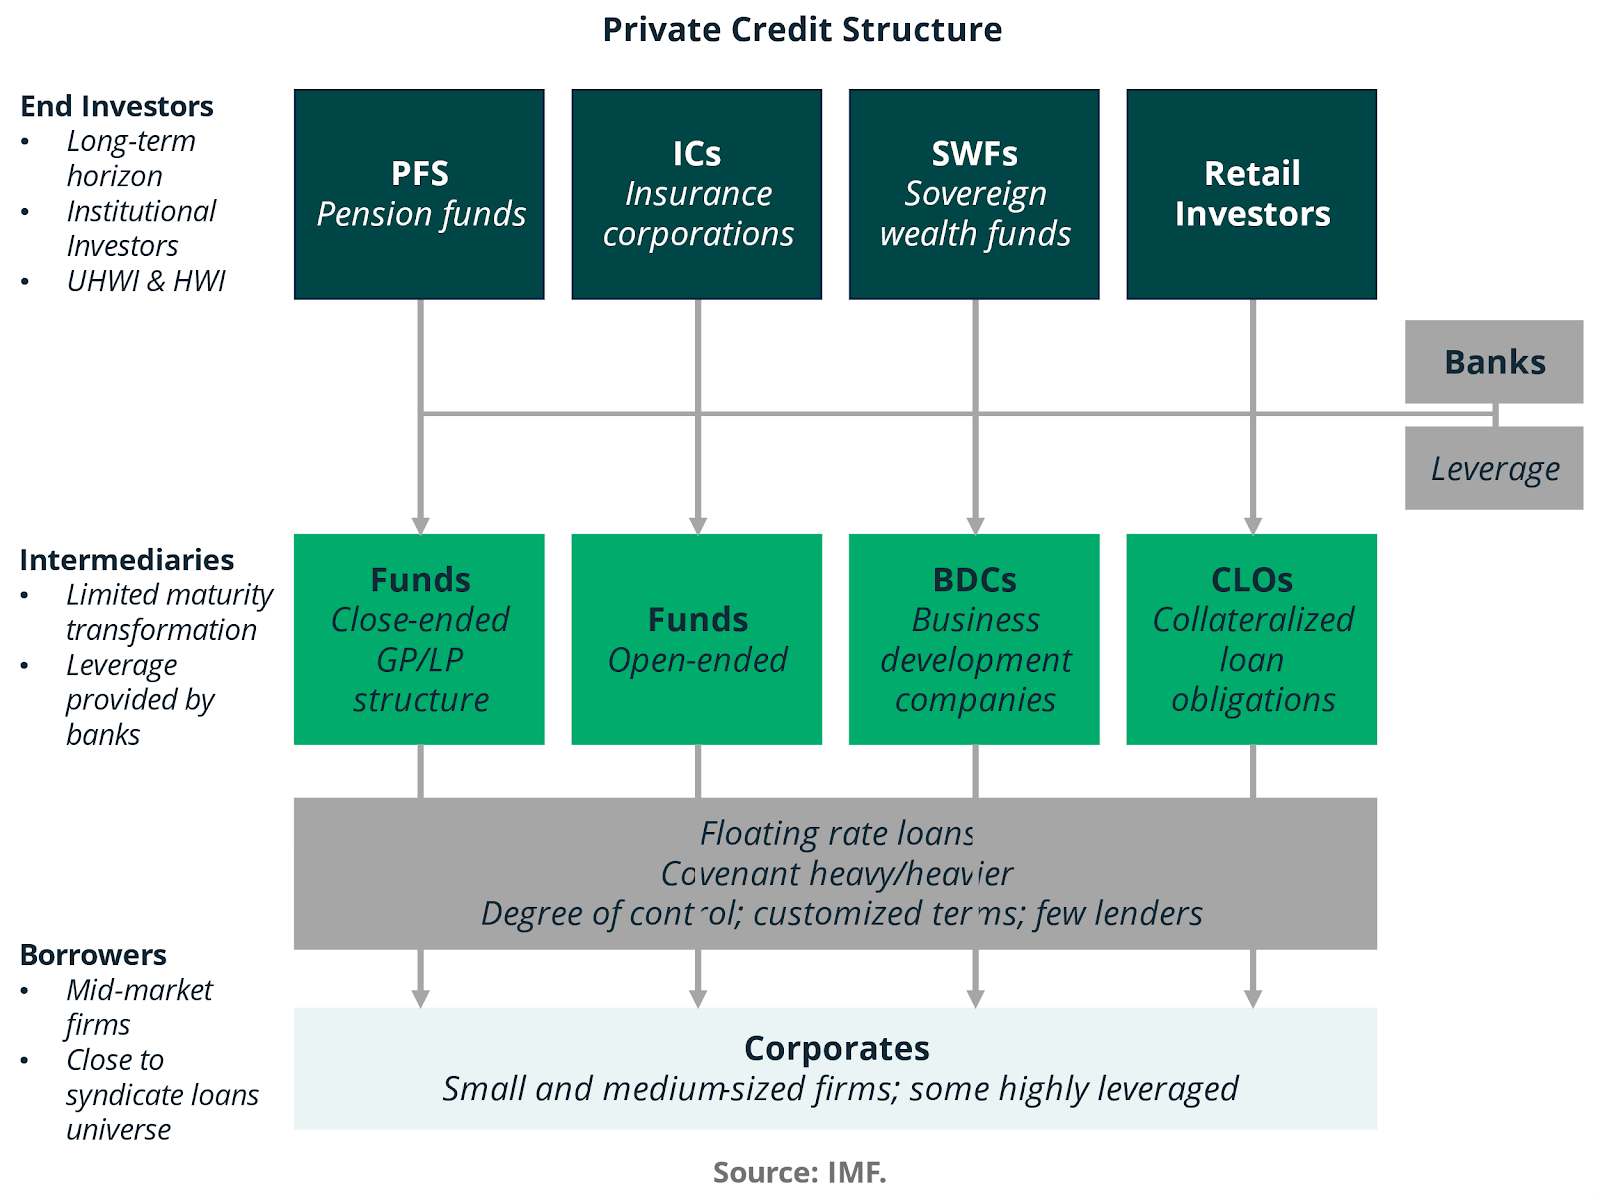
This architecture reflects a deliberate maturity transformation and risk pricing outside the traditional banking system. It also highlights why private credit is structurally positioned to absorb credit demand when regulated lenders retrench. Capital is raised from investors seeking predictable income and is deployed into customized loans where underwriting discipline and covenant protection can be negotiated directly.
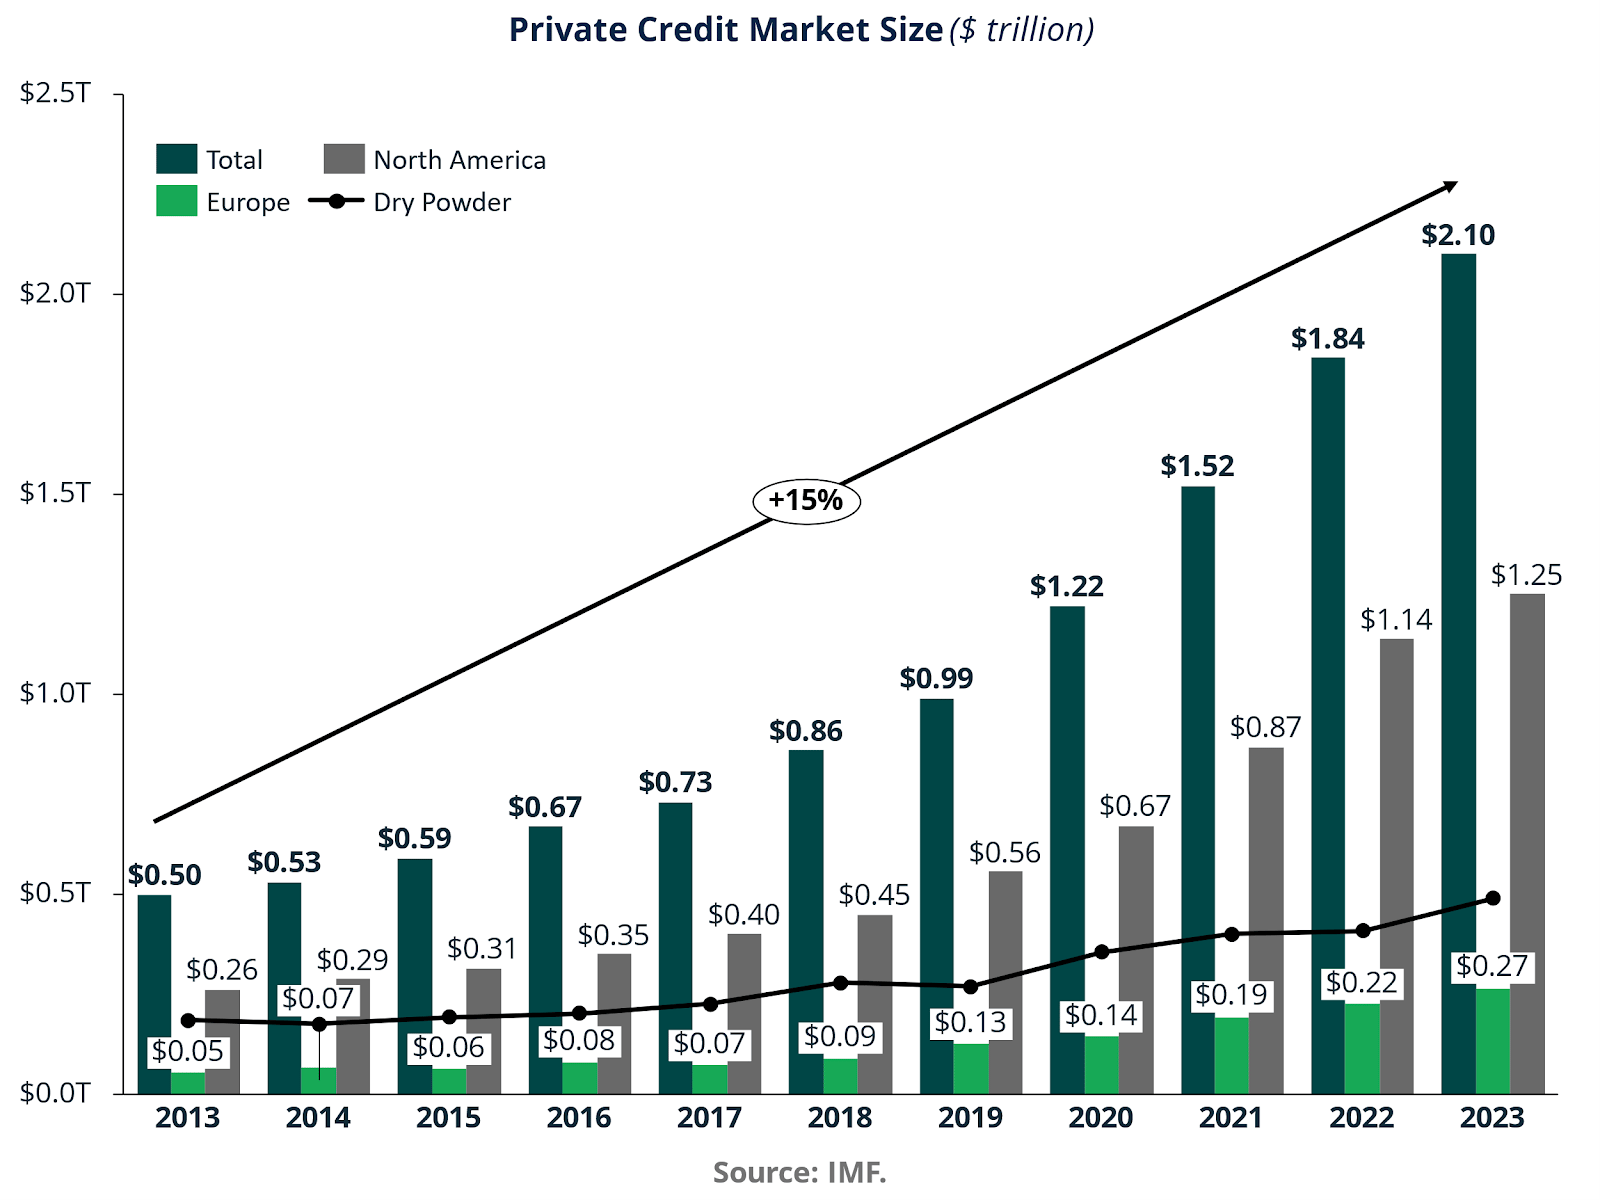
The scale expansion over the last decade has been extraordinary. Global private credit assets increased from approximately $0.50 trillion in 2013 to $2.10 trillion in 2023, representing a compound annual growth rate of roughly 15%. North America alone grew from $0.26 trillion to $1.25 trillion over the same period. Europe expanded from $0.05 trillion to 0.27 trillion, confirming that the growth dynamic is not confined to a single geography.
Equally important is the buildup of dry powder, which rose from $0.17 trillion in 2013 to approximately $0.48 trillion in 2023. This undeployed capital represents forward lending capacity and indicates that institutional appetite has continued to outpace immediate deployment opportunities.
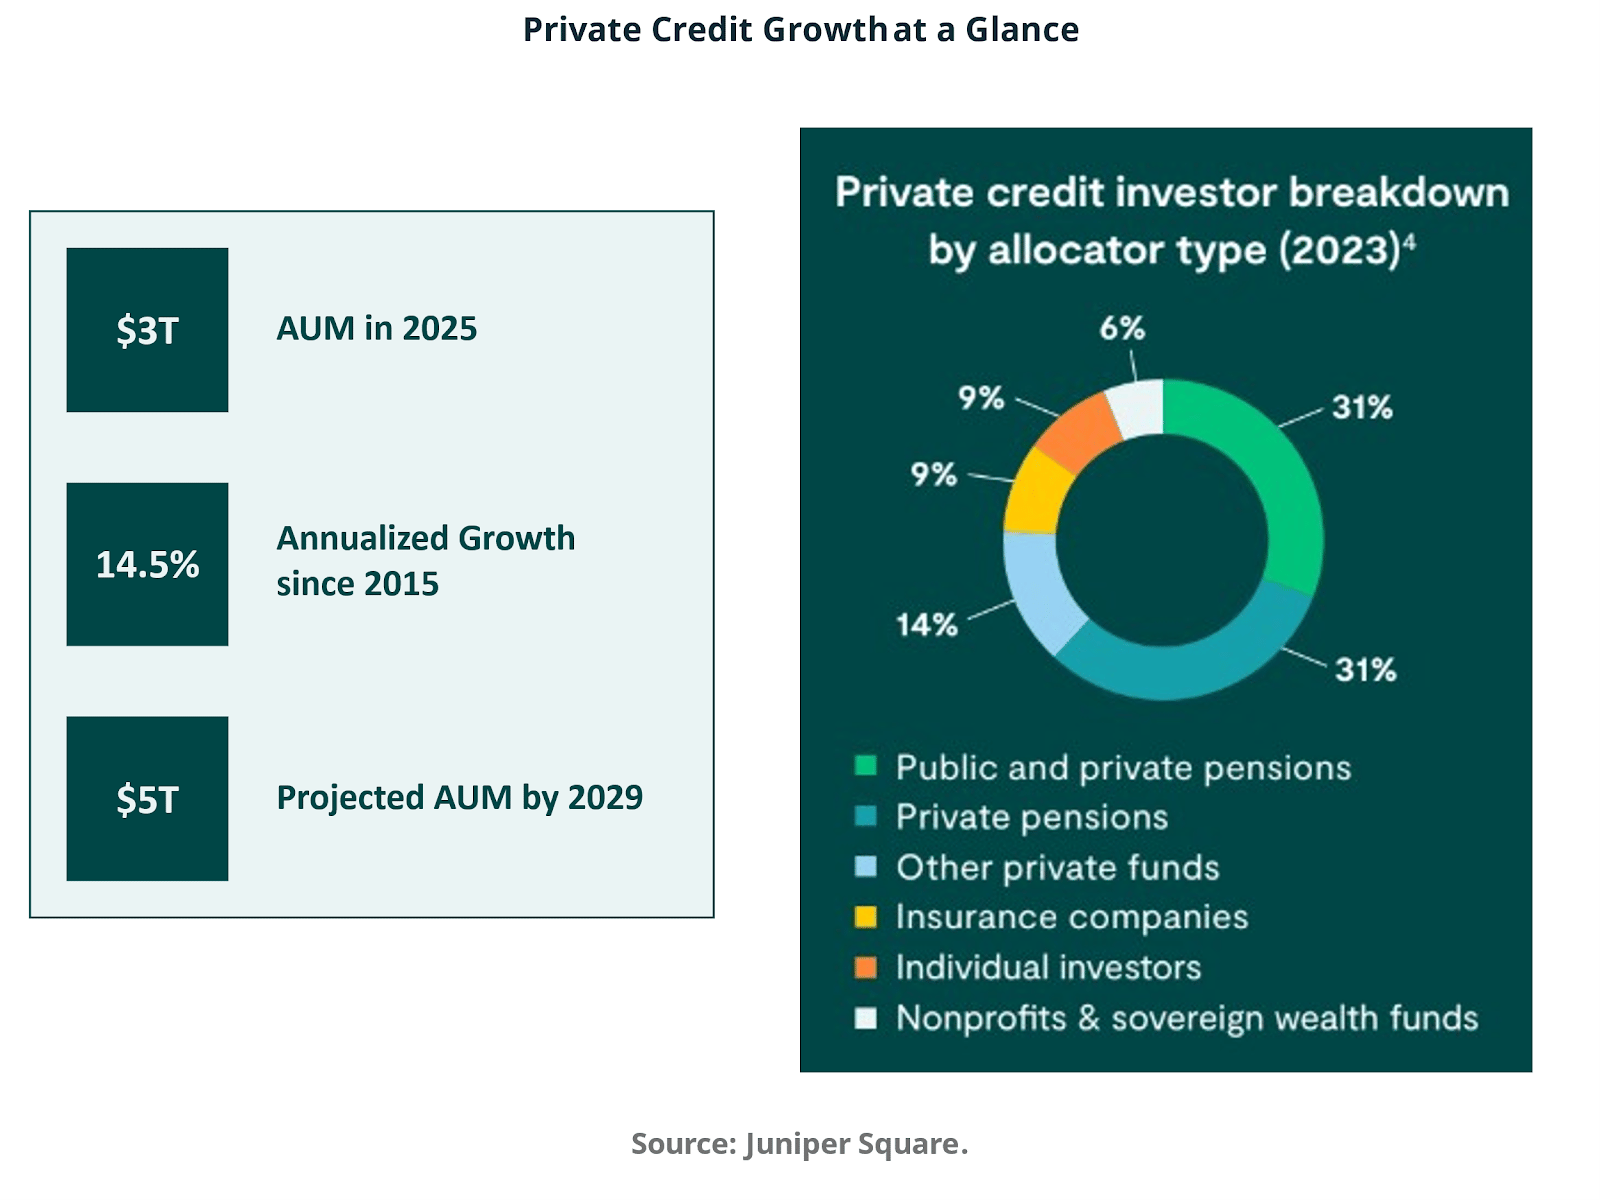
The broader growth trajectory reinforces this structural shift. Assets under management are estimated at roughly $3 trillion in 2025, up from $0.5 trillion a decade earlier. Annualized growth since 2015 stands at 14.5%, with projections suggesting $5 trillion by 2029.
These figures signal that private credit has transitioned from a niche allocation to a core institutional exposure.
The investor base composition in 2023 further demonstrates institutionalization. Public and private pensions account for 31% of capital, private pensions another 31%, other private funds 14%, insurance companies 9%, individual investors 9%, and nonprofits and sovereign wealth funds 6%. The dominance of long-horizon allocators underscores the stability of funding sources.
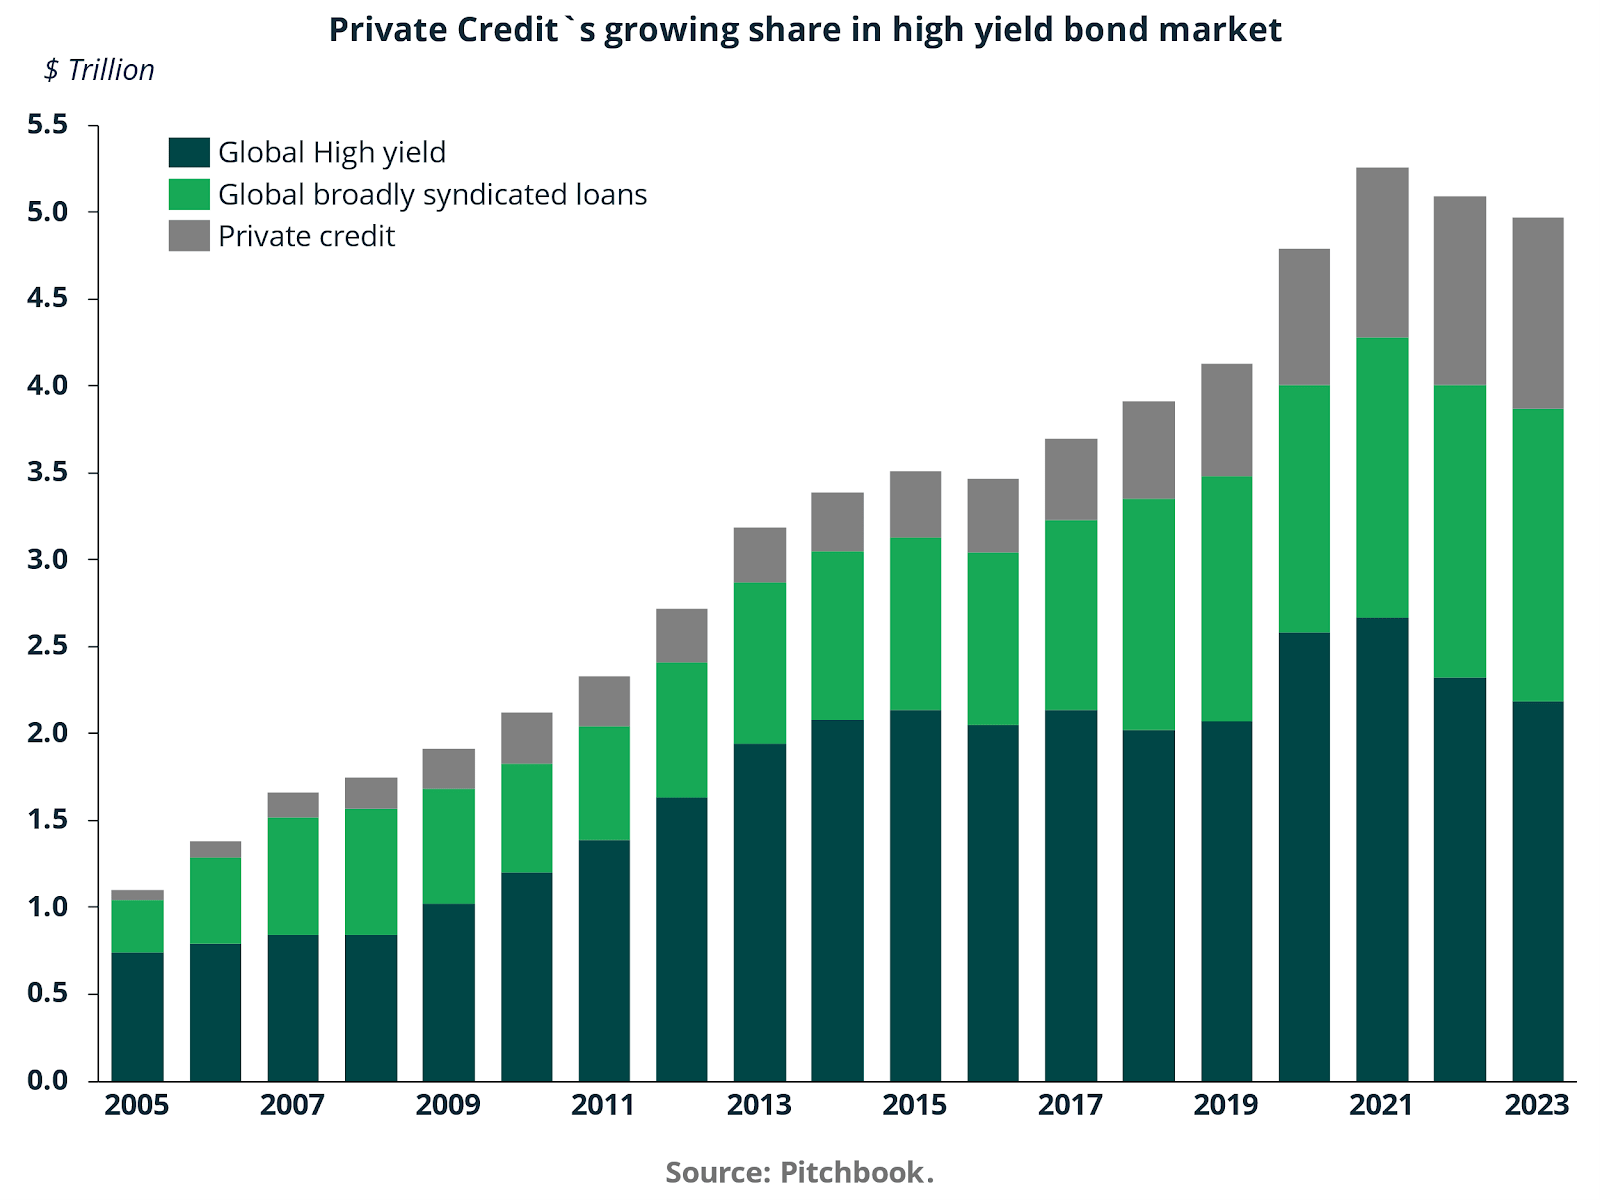
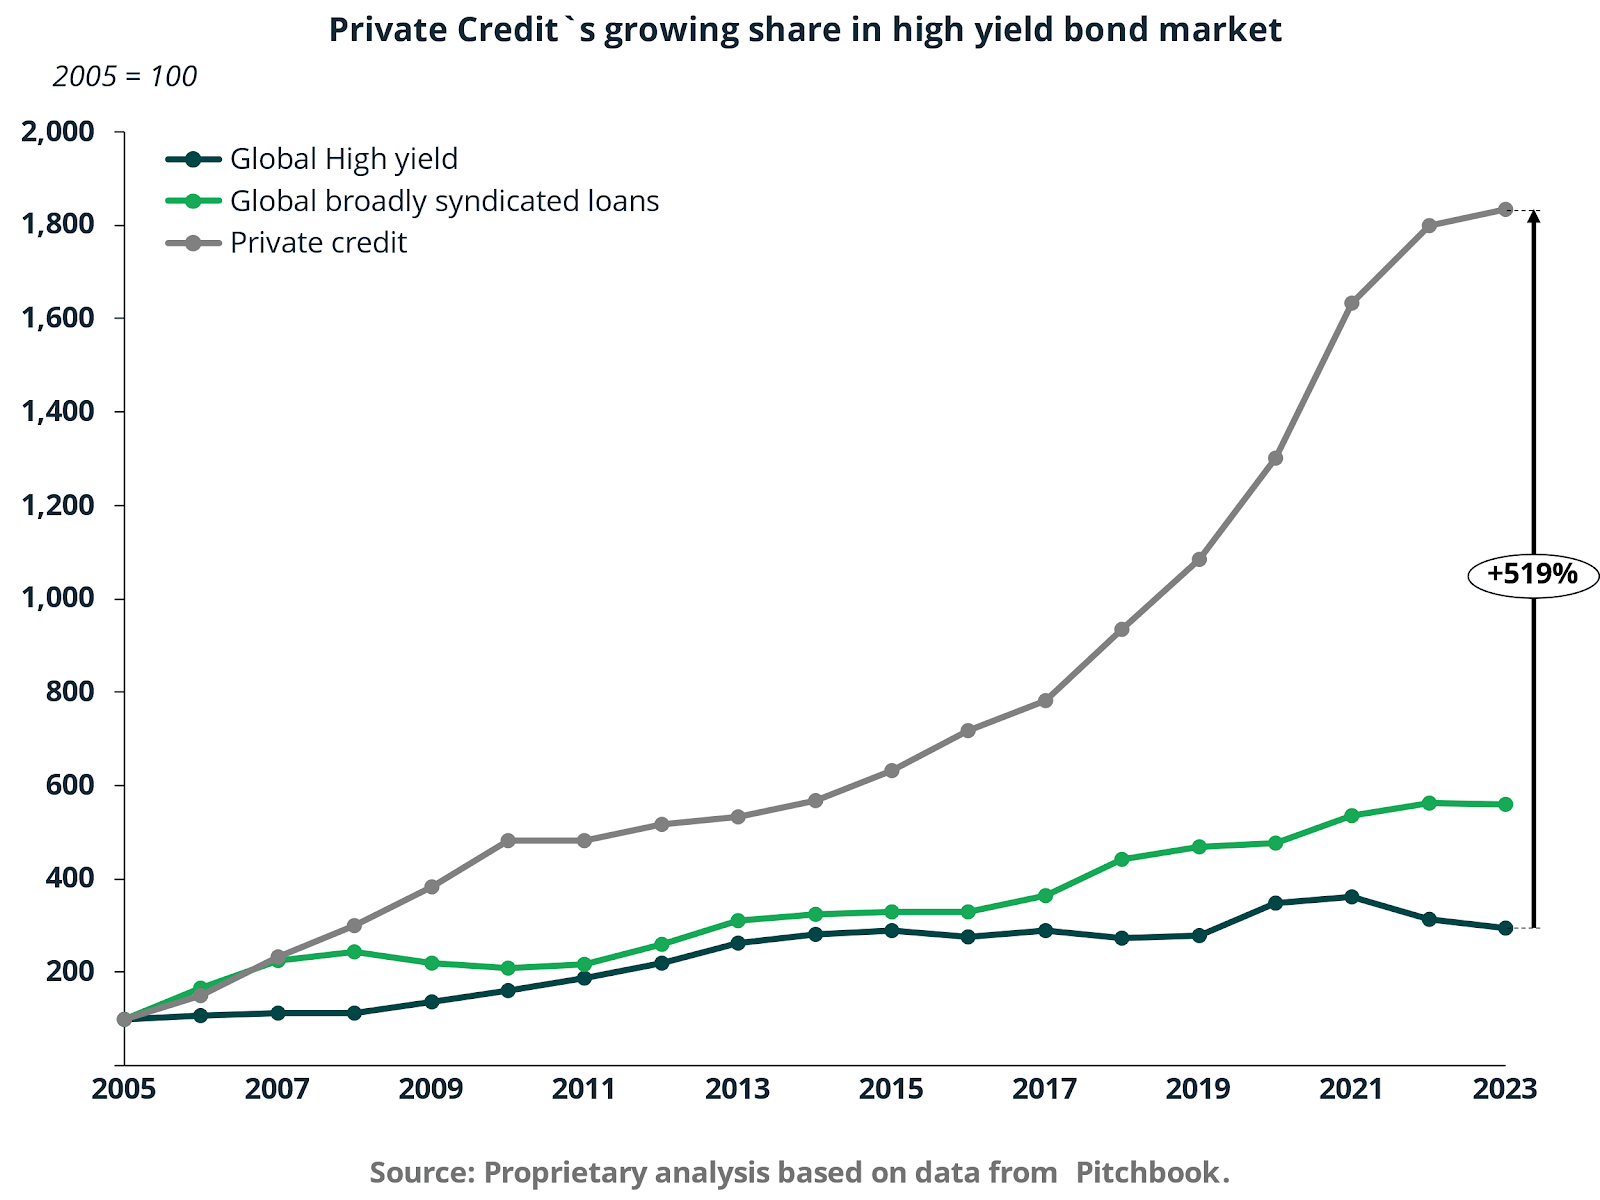
Private credit’s systemic relevance becomes clearer when benchmarked against public credit markets. Since 2005, private credit has expanded by approximately 519% on an indexed basis, materially outpacing global high yield bonds and broadly syndicated loans, which exhibit comparatively modest growth trajectories. This divergence reflects a structural reallocation of credit intermediation away from public issuance toward private origination.
The implication is not cyclical substitution but a reordering of capital markets. Borrowers increasingly prefer certainty of execution and bespoke structuring, while investors accept illiquidity in exchange for enhanced yield and governance control.
Private Credit Addressable Market
Despite rapid growth, private credit still accounts only for a fraction of the total credit universe. Total US lending balances in 2024 amount to approximately $34 trillion. Within this, commercial and corporate finance totals $5.7 trillion, of which $1.8 trillion is already nonbank funded. Commercial real estate totals $4.6 trillion with $1.5 trillion funded outside banks. Consumer finance stands at $9.2 trillion, including $1.9 trillion from non-banks. Securitized products alone account for $12.1 trillion dollars.
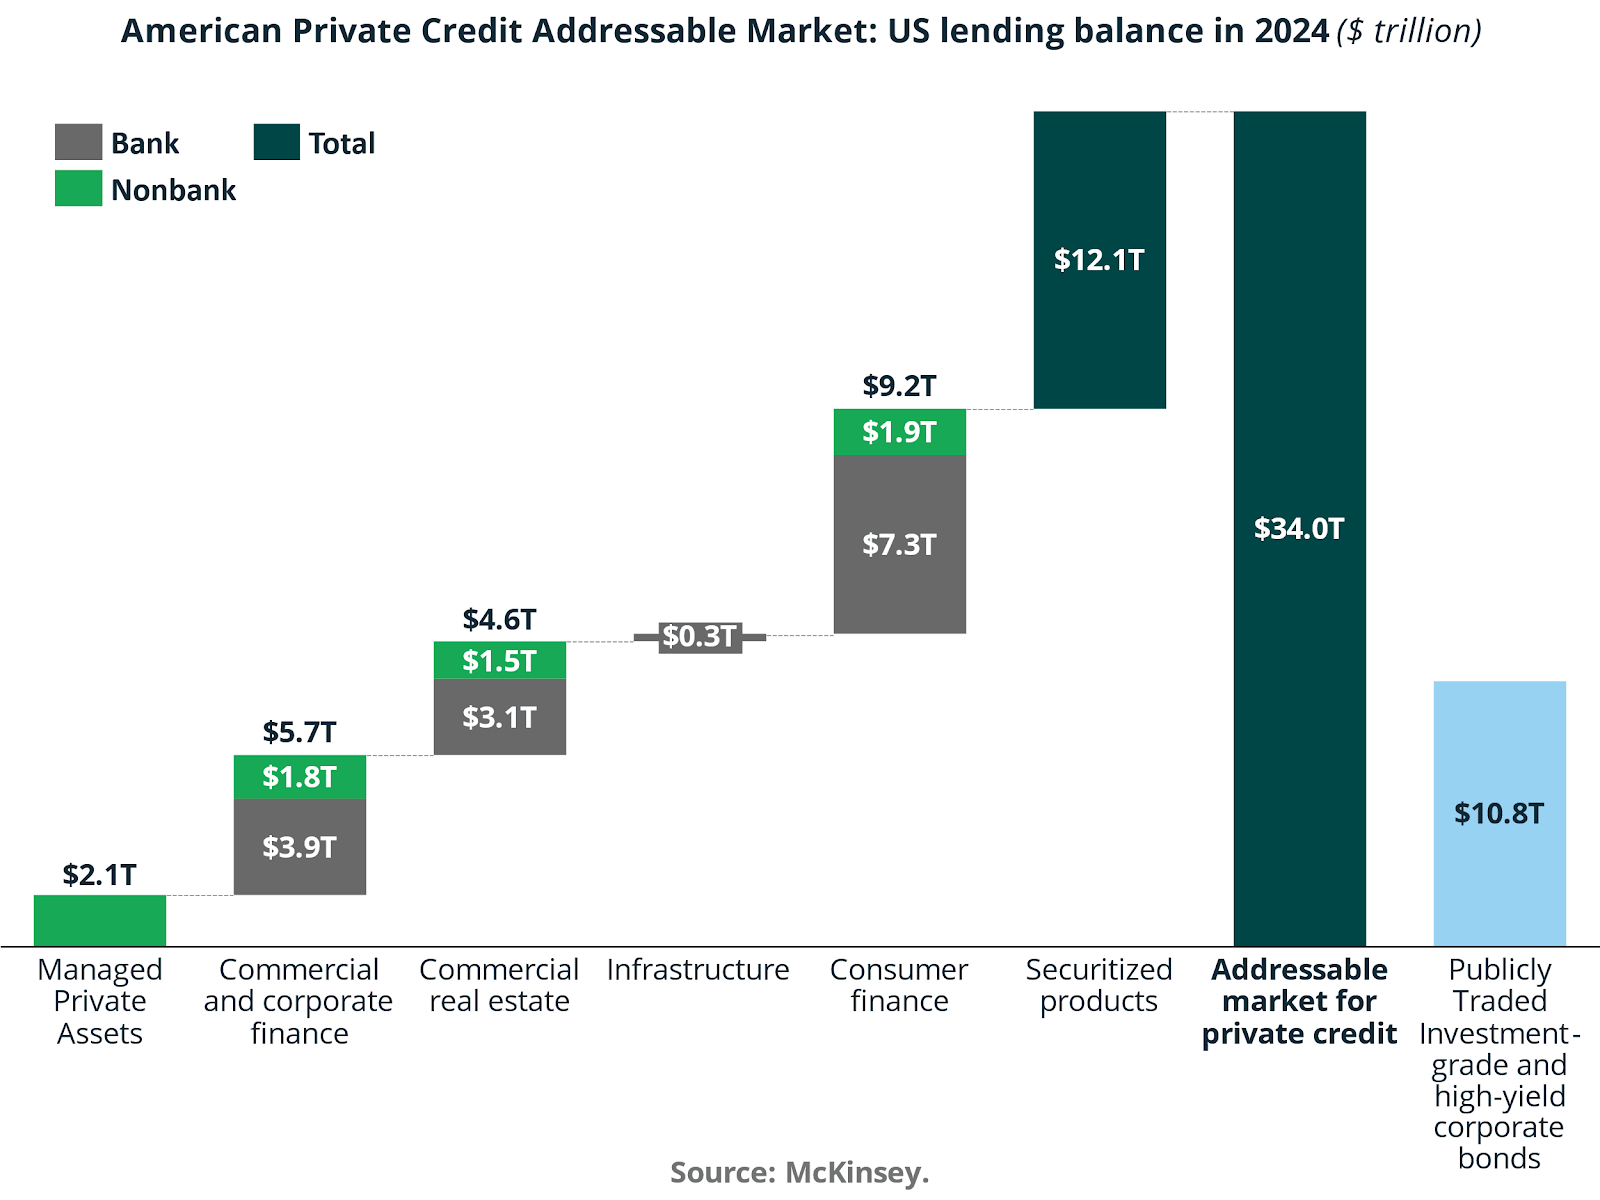
This framing reveals substantial headroom. Even modest incremental share gains across these segments would translate into trillions of additional addressable assets for private credit platforms.
Structurally, the market is anchored by secured lending, which represents 55.8% of total deals. The share rises to 63.5% in industrial machinery, 57.4% in health care and 50.2% in IT infrastructure. Mezzanine accounts for 25.7% overall, with a higher 30.5% share in software, reflecting the asset-light nature of that sector. Unitranche comprises 7.1% overall but reaches 22.4% in software and 11.0% in healthcare.
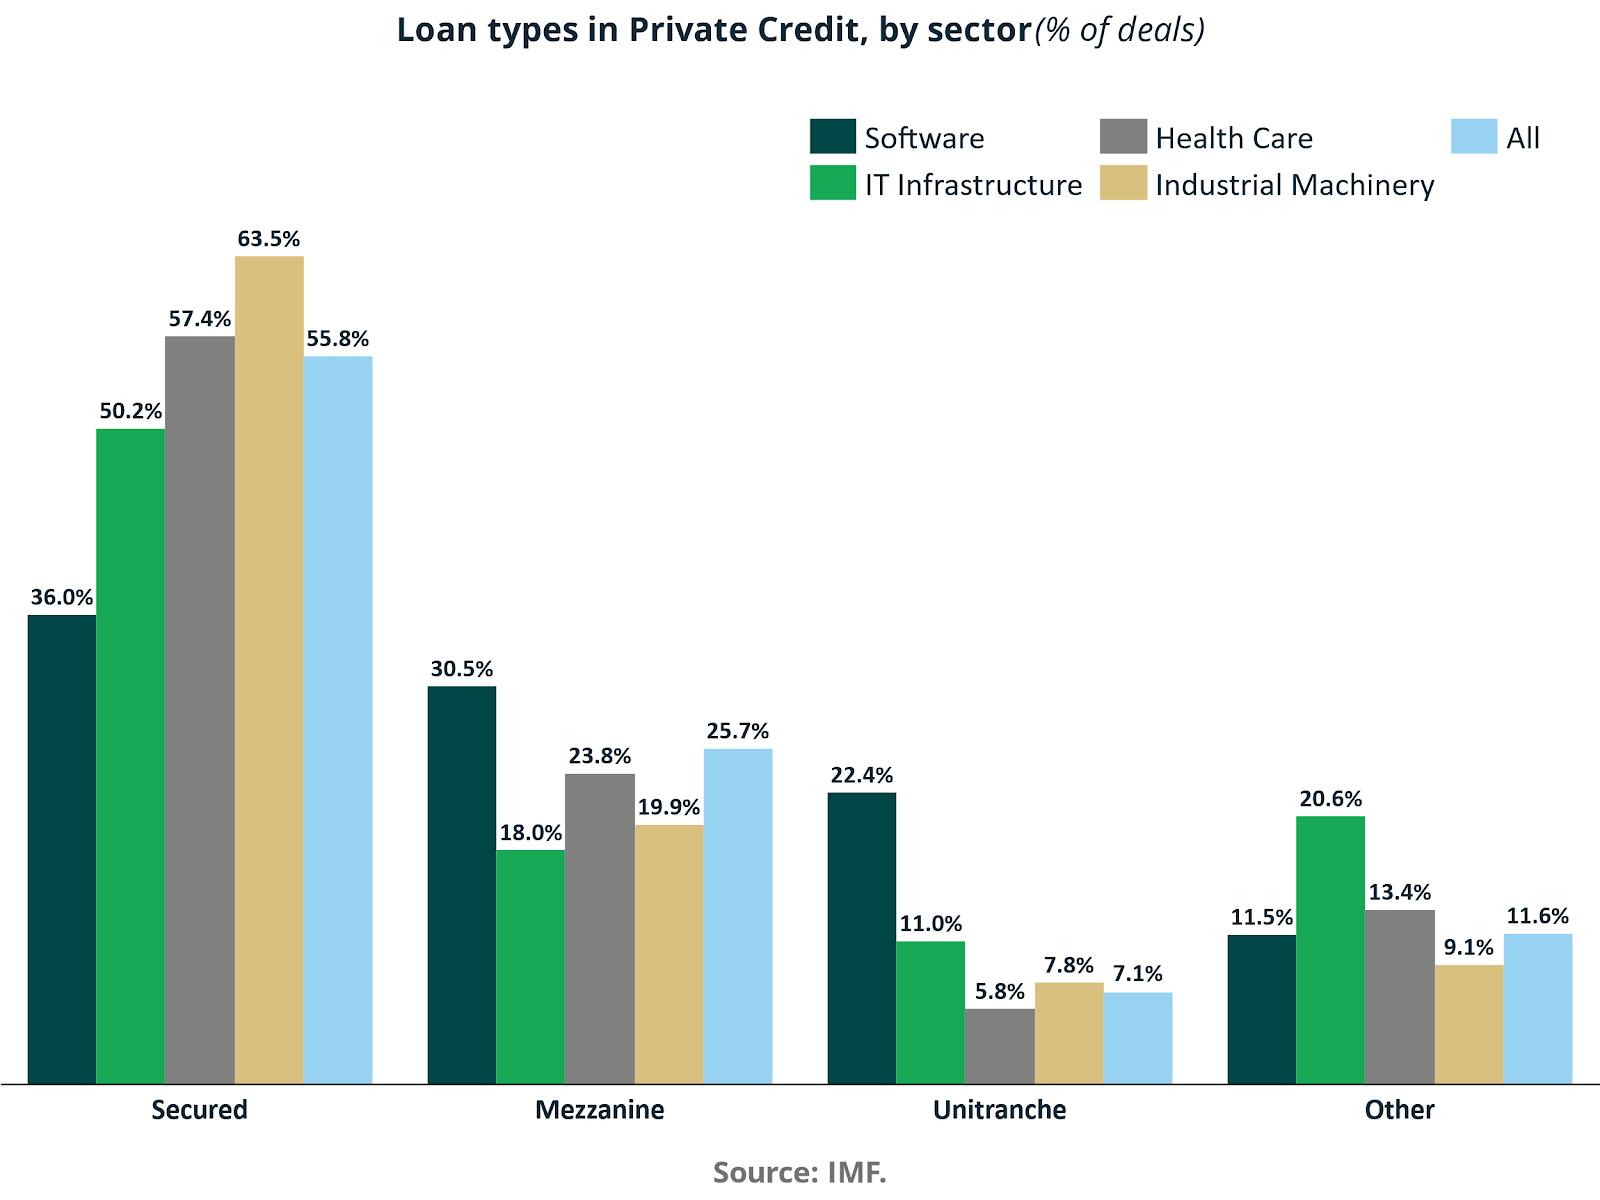
This distribution illustrates how private credit adapts to sector-specific balance sheet characteristics. Senior secured structures dominate capital-intensive industries, while hybrid and subordinated formats are deployed in growth-oriented segments where enterprise value protection substitutes for hard collateral.
Credit Performance
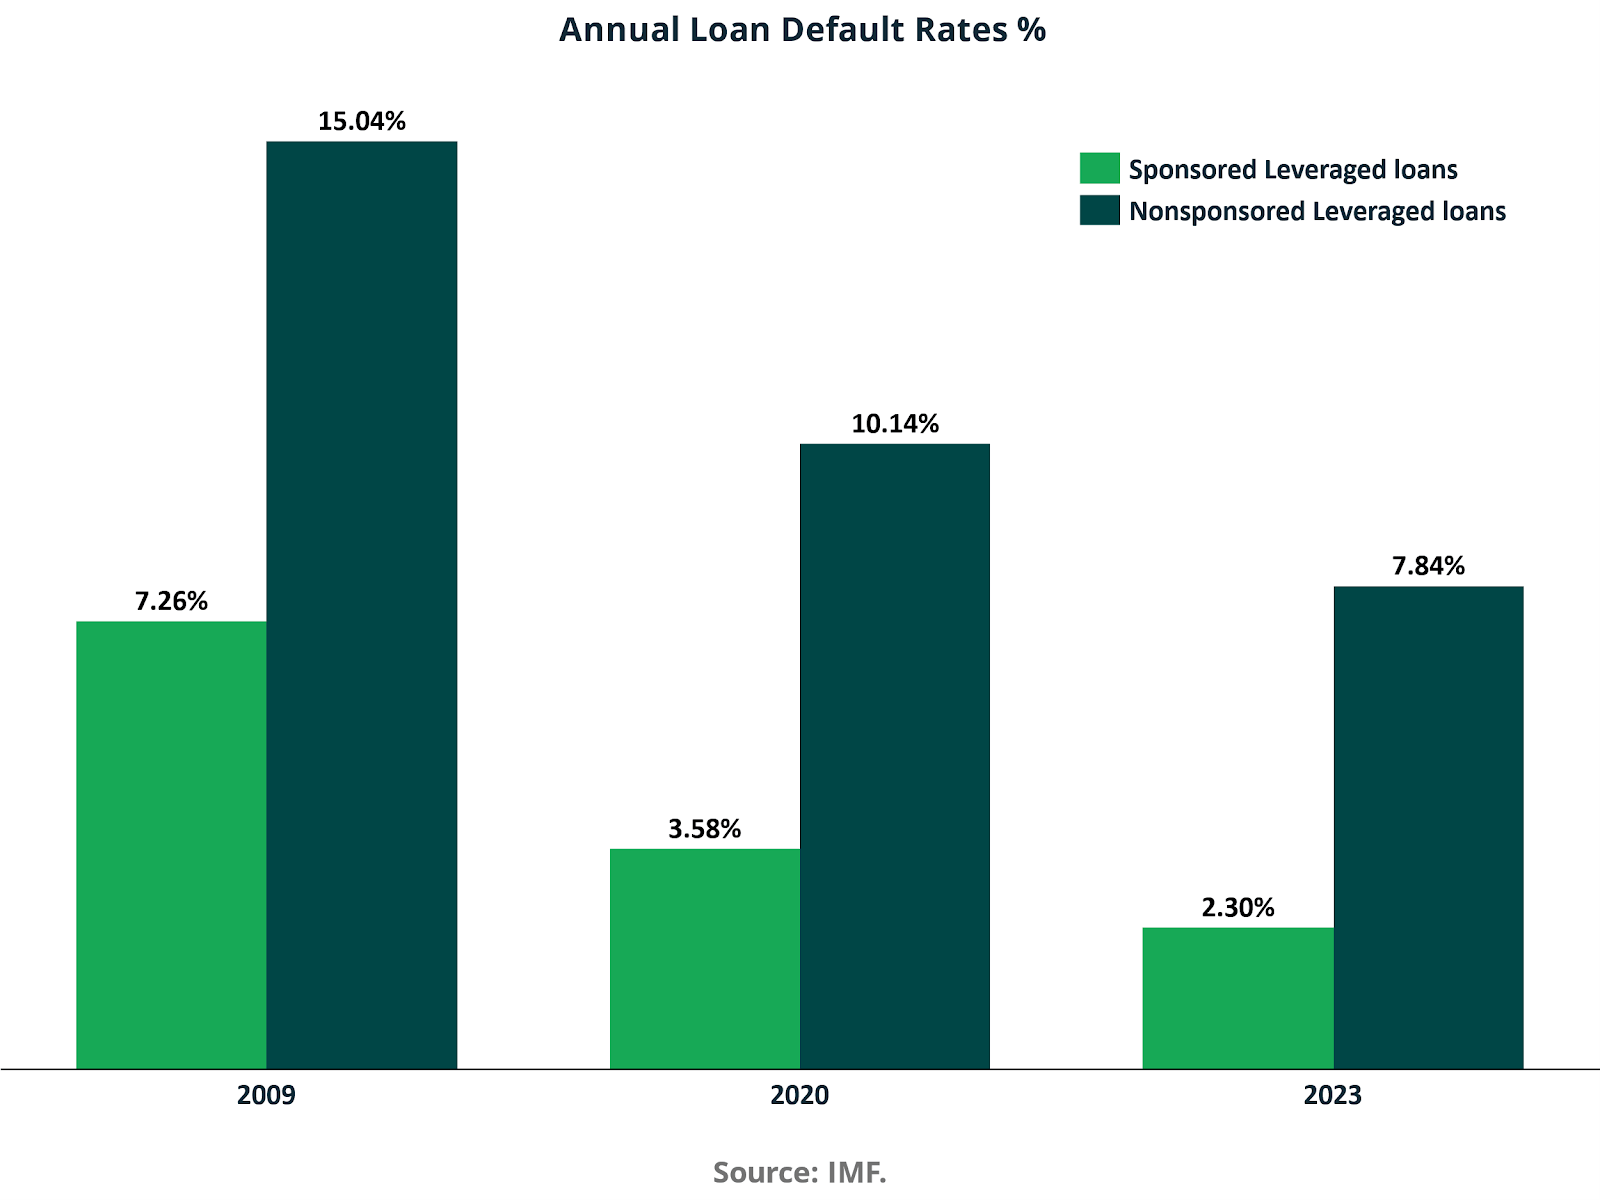
Credit performance further supports the asset class thesis. Sponsored leveraged loans show default rates declining from 7.26% in 2009 to 3.58% in 2020 and 2.30% in 2023. Non-sponsored leveraged loans exhibit materially higher default rates at 15.04% in 2009, 10.14% in 2020, and 7.84% in 2023.
The differential highlights the role of private equity sponsorship, governance oversight, and active capital management in mitigating downside risk. It also reinforces the importance of structural seniority and covenant discipline in preserving capital through economic cycles.
Taken together, these seven dimensions of structure, scale, growth, market share, addressable opportunity, deal composition, and credit performance depict an asset class that has moved beyond opportunistic lending. Private credit has become a core pillar of modern credit markets, supported by institutional capital, differentiated underwriting, and expanding competitive positioning relative to traditional banks.
Returns: Risk Adjusted Superiority and Structural Resilience
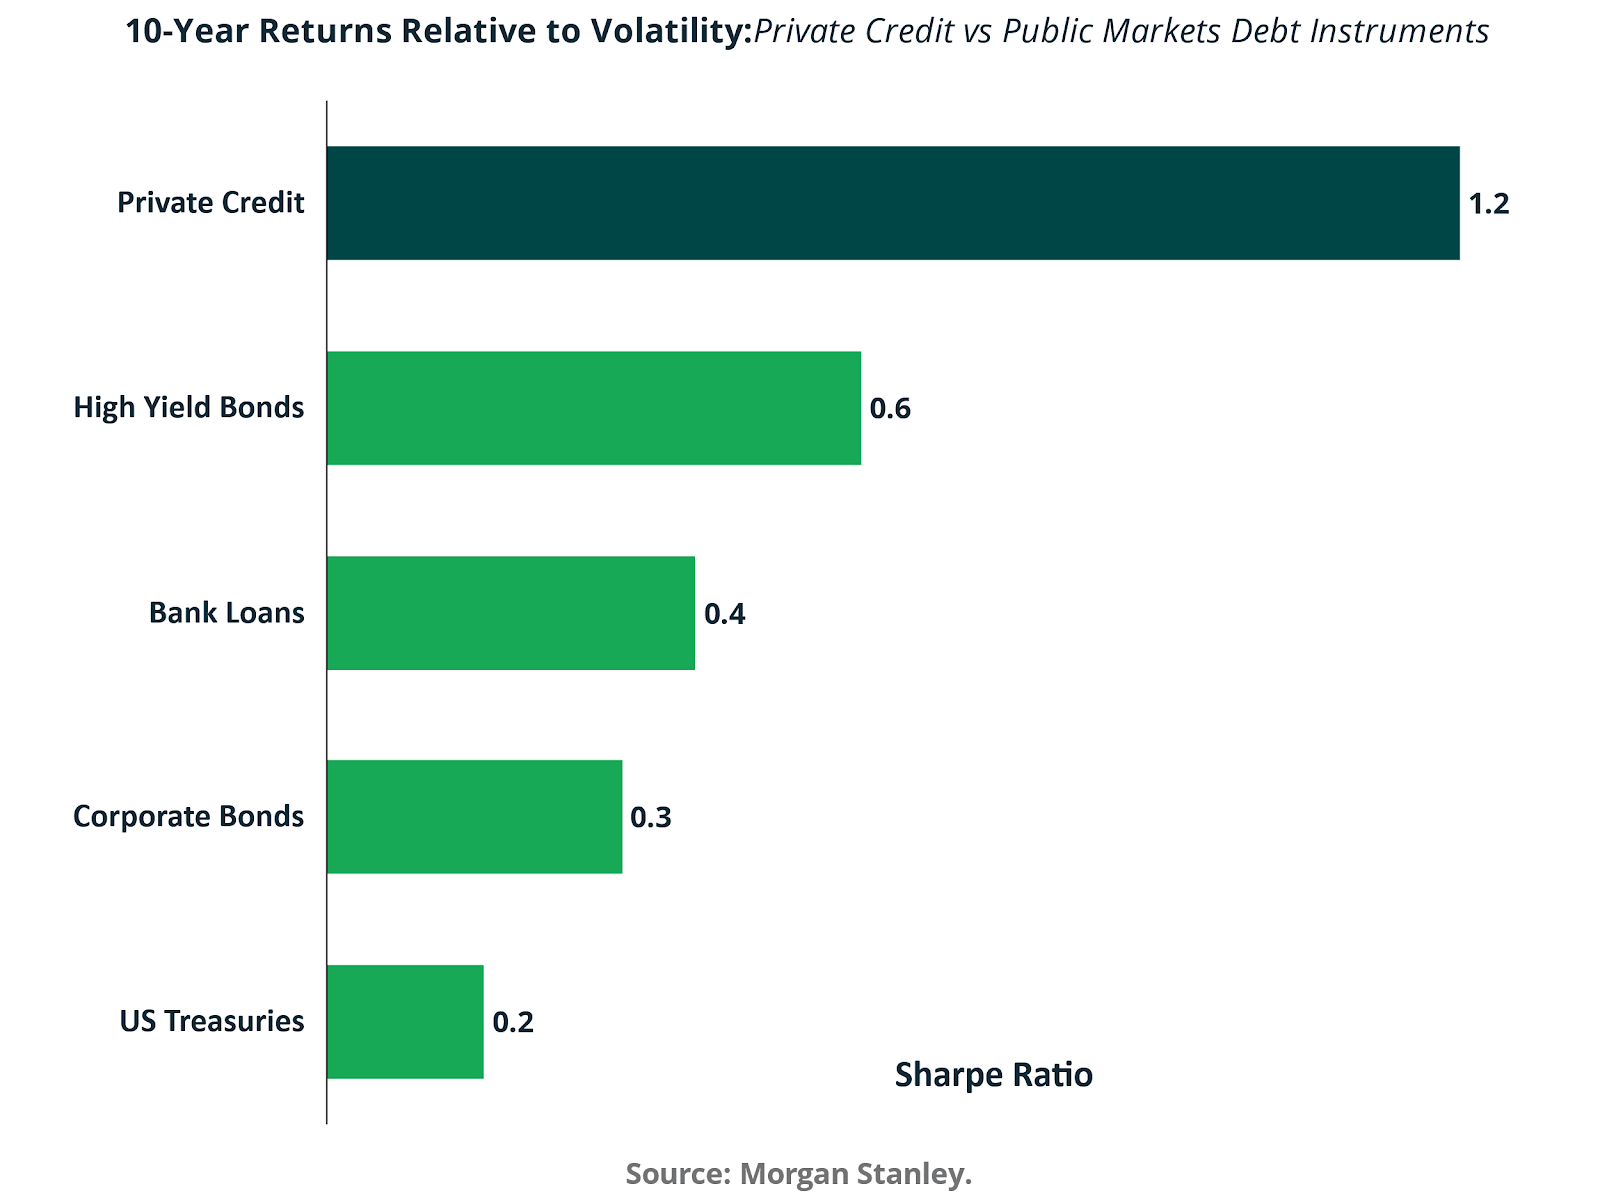
Over a ten- year horizon, private credit demonstrates clear risk-adjusted outperformance relative to traditional public debt instruments. The Sharpe ratio for private credit stands at 1.2, compared with 0.6 for high yield bonds, 0.4 for bank loans, 0.3 for corporate bonds, and 0.2 for US Treasuries. This implies that on a volatility-normalized basis, private credit has generated approximately double the efficiency of high yield and materially higher efficiency than broadly syndicated loan markets. From a portfolio construction standpoint, this positions private credit not simply as a yield enhancement tool, but as a superior risk-adjusted income allocation.
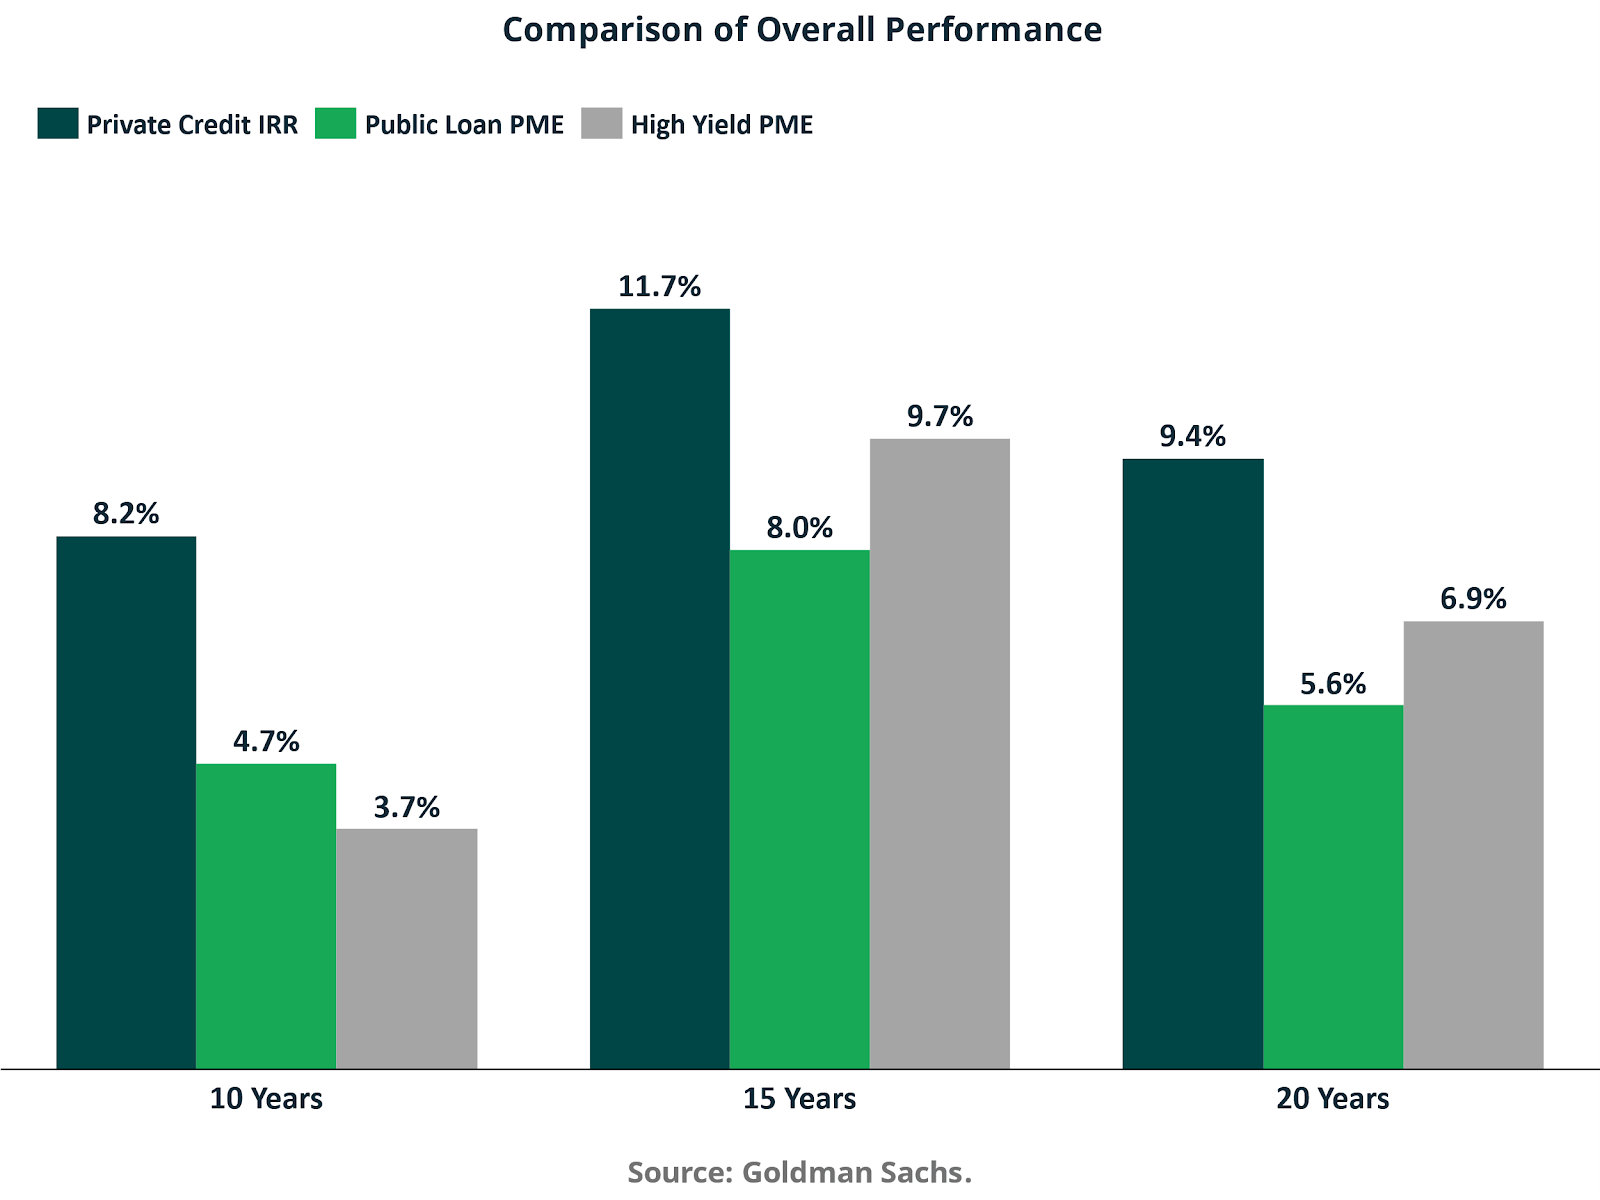
Absolute performance reinforces the same conclusion. Over ten years, private credit IRR averages 8.2%, versus 4.7% for public loans on a PME basis and 3.7% for high yield. Over fifteen years, private credit rises to 11.7% compared with 8.0% for public loans and 9.7% for high yield.
Even over twenty years, where public markets benefit from multiple cycles, private credit still delivers 9.4% relative to 5.6% and 6.9% respectively.
The persistence of outperformance across time horizons suggests that structural features such as floating rate exposure, tighter documentation and direct negotiation rights have created durable excess returns rather than episodic alpha.
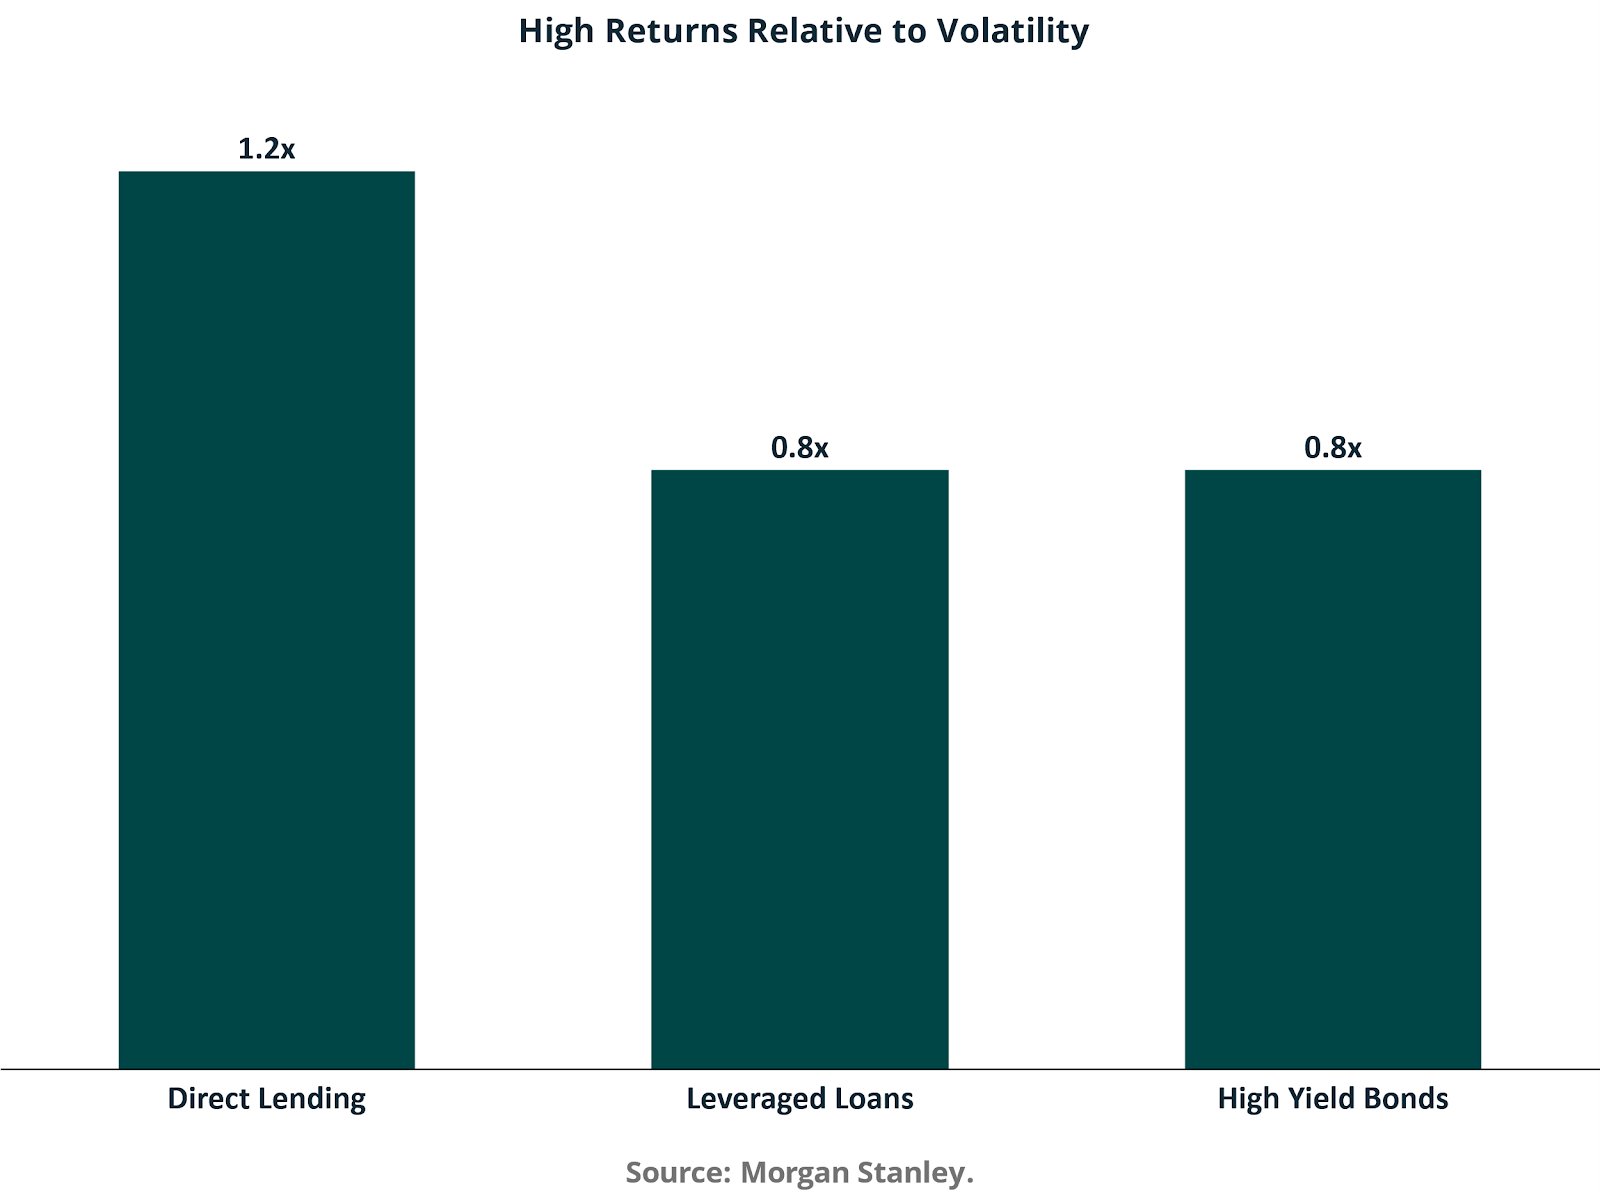
When isolating direct lending, the efficiency gap becomes even clearer. Direct lending produces approximately 1.2 times return per unit of volatility, compared with 0.8 times for leveraged loans and 0.8 times for high yield bonds. This indicates that the incremental illiquidity and structural control embedded in direct lending has translated into higher compensation per unit of risk borne.
For allocators focused on Sharpe maximization, this differential is economically meaningful. It suggests that private credit improves frontier efficiency rather than simply raising nominal yield.
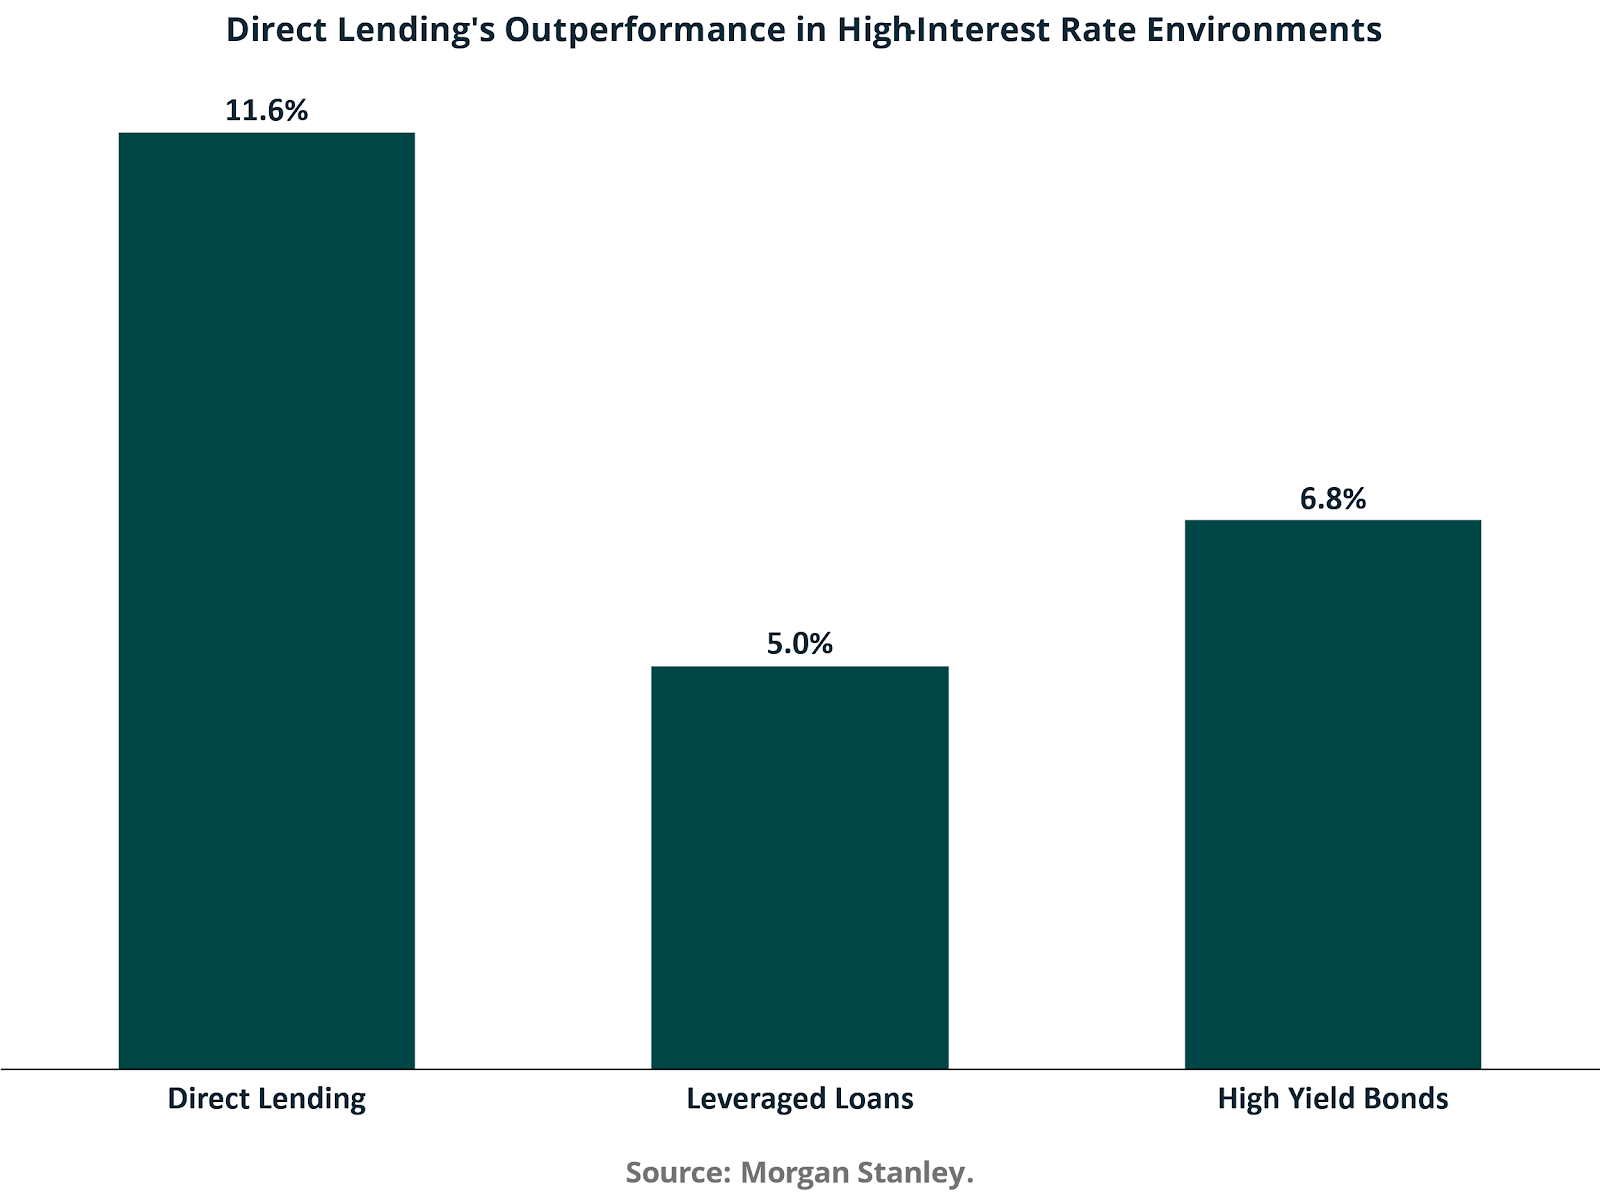
Performance in rising rate environments further highlights structural advantages. In periods characterized by elevated interest rates, direct lending has delivered returns of approximately 11.6%, compared with 5.0% for leveraged loans and 6.8% for high-yield bonds. Because most private credit instruments are floating rate, income resets upward with benchmark rates, mitigating duration risk and preserving real yield.
This dynamic was particularly visible during the 2022 to 2024 tightening cycle, when public fixed-income indices posted negative returns in 2022 while private credit strategies remained positive.
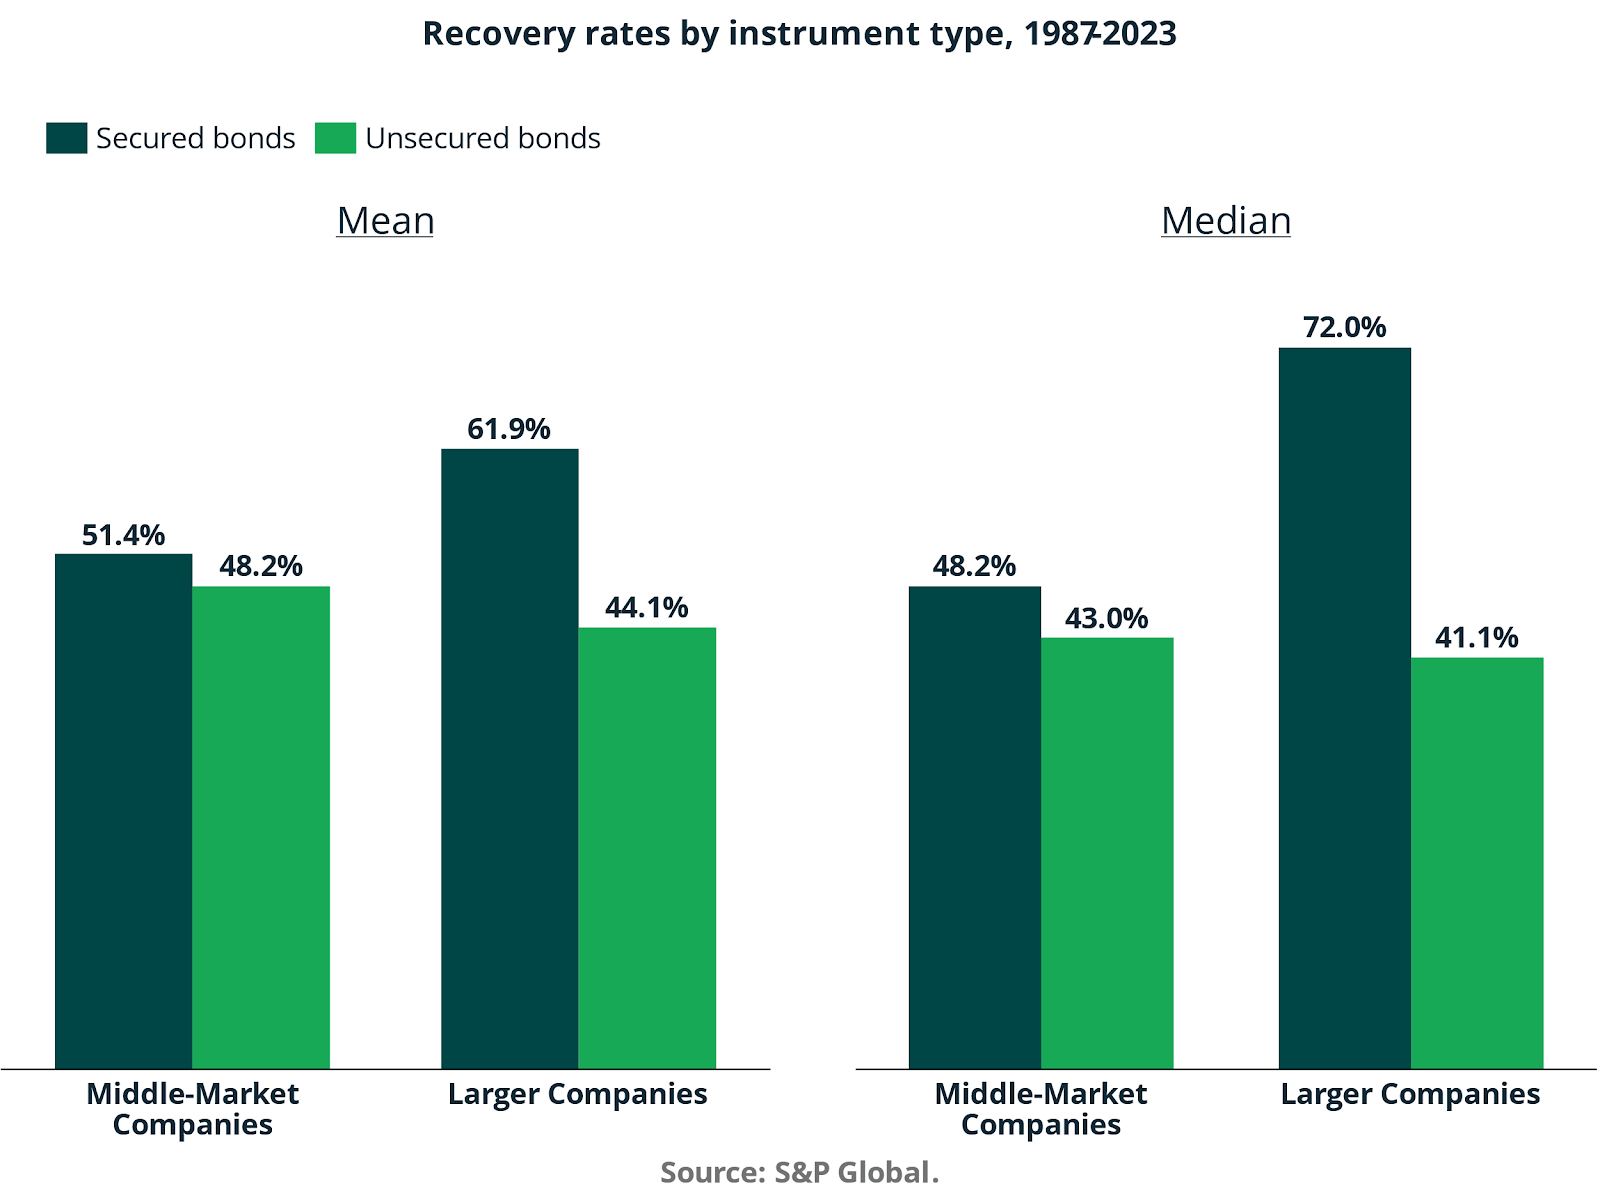
Downside protection metrics also support the asset class case. For larger companies, mean recovery rates on secured bonds reach 61.9%, with median recoveries of 72.0%. In contrast, unsecured bonds show mean recoveries of 44.1% and median recoveries of 41.1%.
Even in middle market companies, secured bonds exhibit mean recoveries of 51.4% versus 48.2% for unsecured bonds.
These statistics reinforce the importance of seniority and collateral coverage, both of which are central to direct lending underwriting frameworks. Higher recovery rates reduce loss given default and enhance long-term compounding.
In a more recent context, private credit has displayed resilience relative to both public bonds and private equity. Between 2020 and 2024, global private credit funds generated average annual returns of 8.5% with a standard deviation of 4.1%. By contrast, global private equity funds averaged 15.3% but with volatility of 18.4%.
During the 2022 market correction, private equity strategies experienced double-digit drawdowns, while private credit returns remained positive at approximately 3.8%.
This asymmetry is critical in volatile macro environments. Private credit has delivered mid- single to low-double-digit returns with materially lower dispersion, providing stability in portfolios otherwise exposed to equity beta.
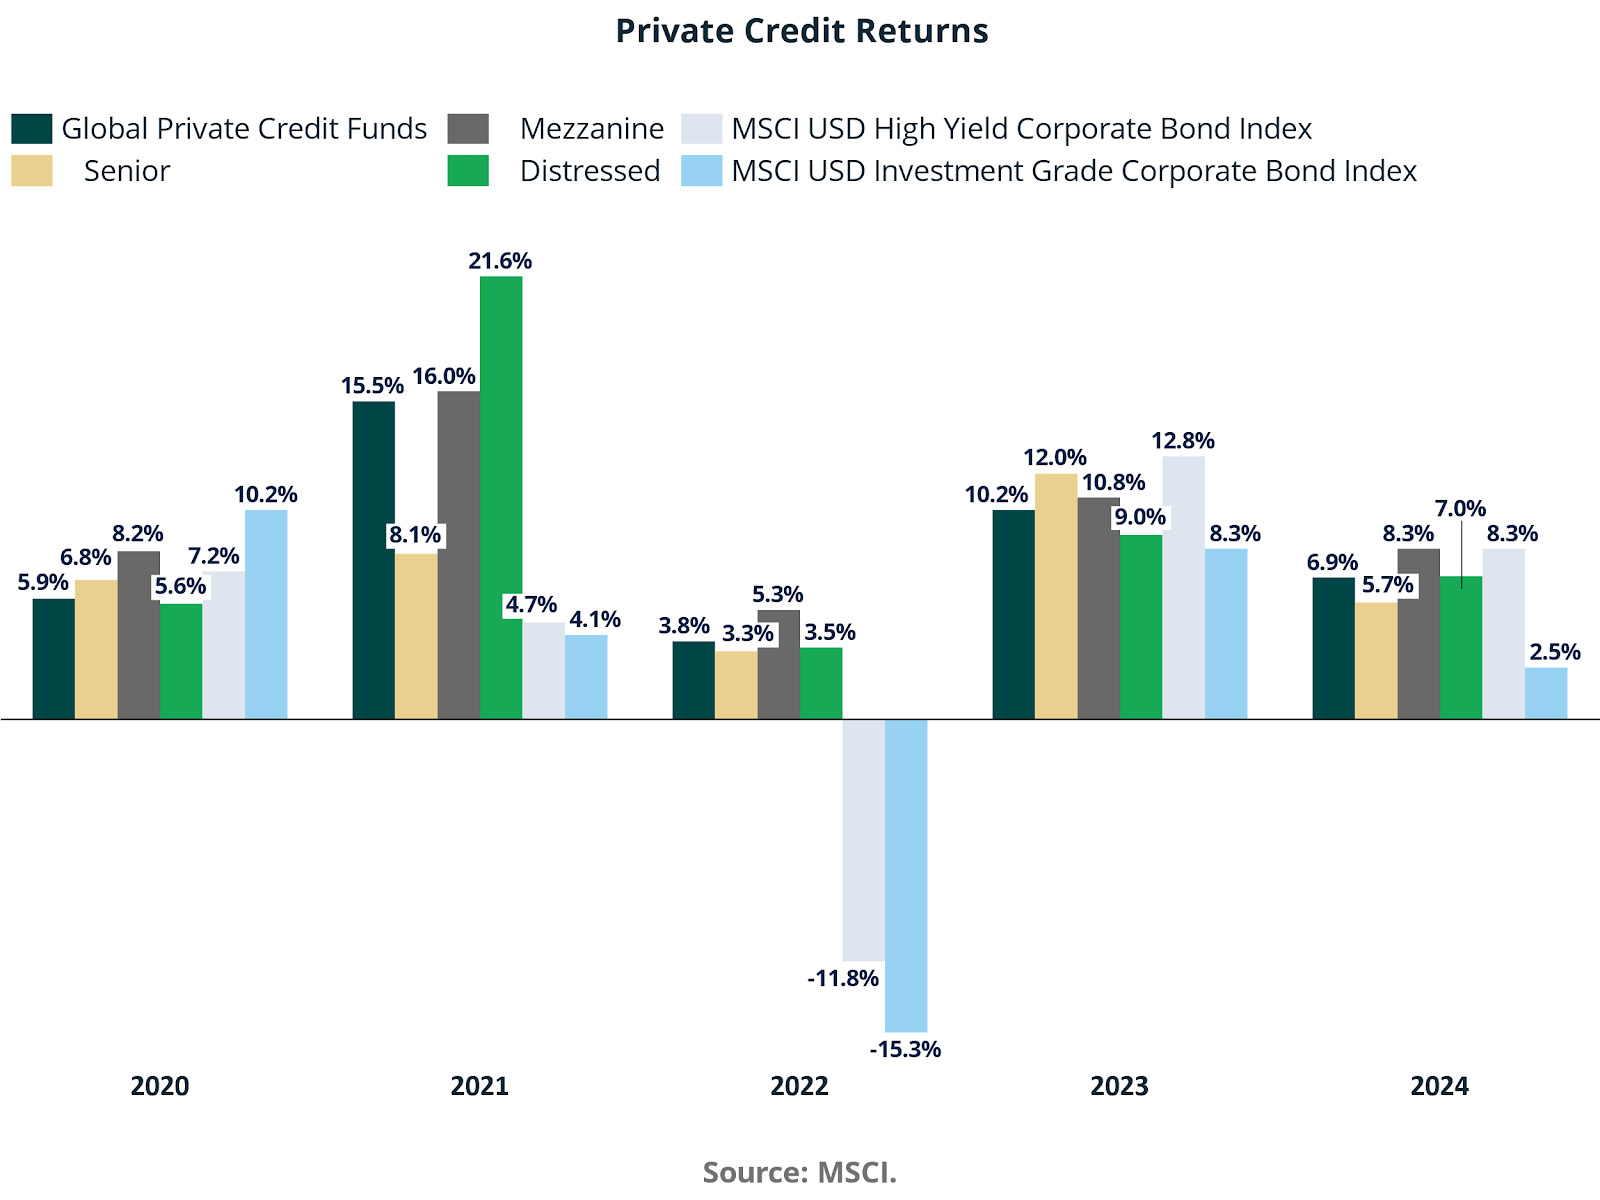
Strategy-level performance illustrates diversification within the asset class. In 2021, distressed credit generated 21.6%, mezzanine 16.0%, and global private credit funds 15.5%. In 2022, while public high-yield and investment-grade indices declined by 11.8% and 15.3% respectively, private credit strategies still delivered positive returns between 3.3% and 5.3%.
In 2023, senior private credit returned 12.0% and global private credit funds returned 10.2%, outperforming investment-grade bonds at 8.3%. In 2024, private credit funds produced 6.9% compared with 2.5% for investment-grade bonds. These outcomes demonstrate defensive characteristics during stress periods and competitive income generation during recovery phases.
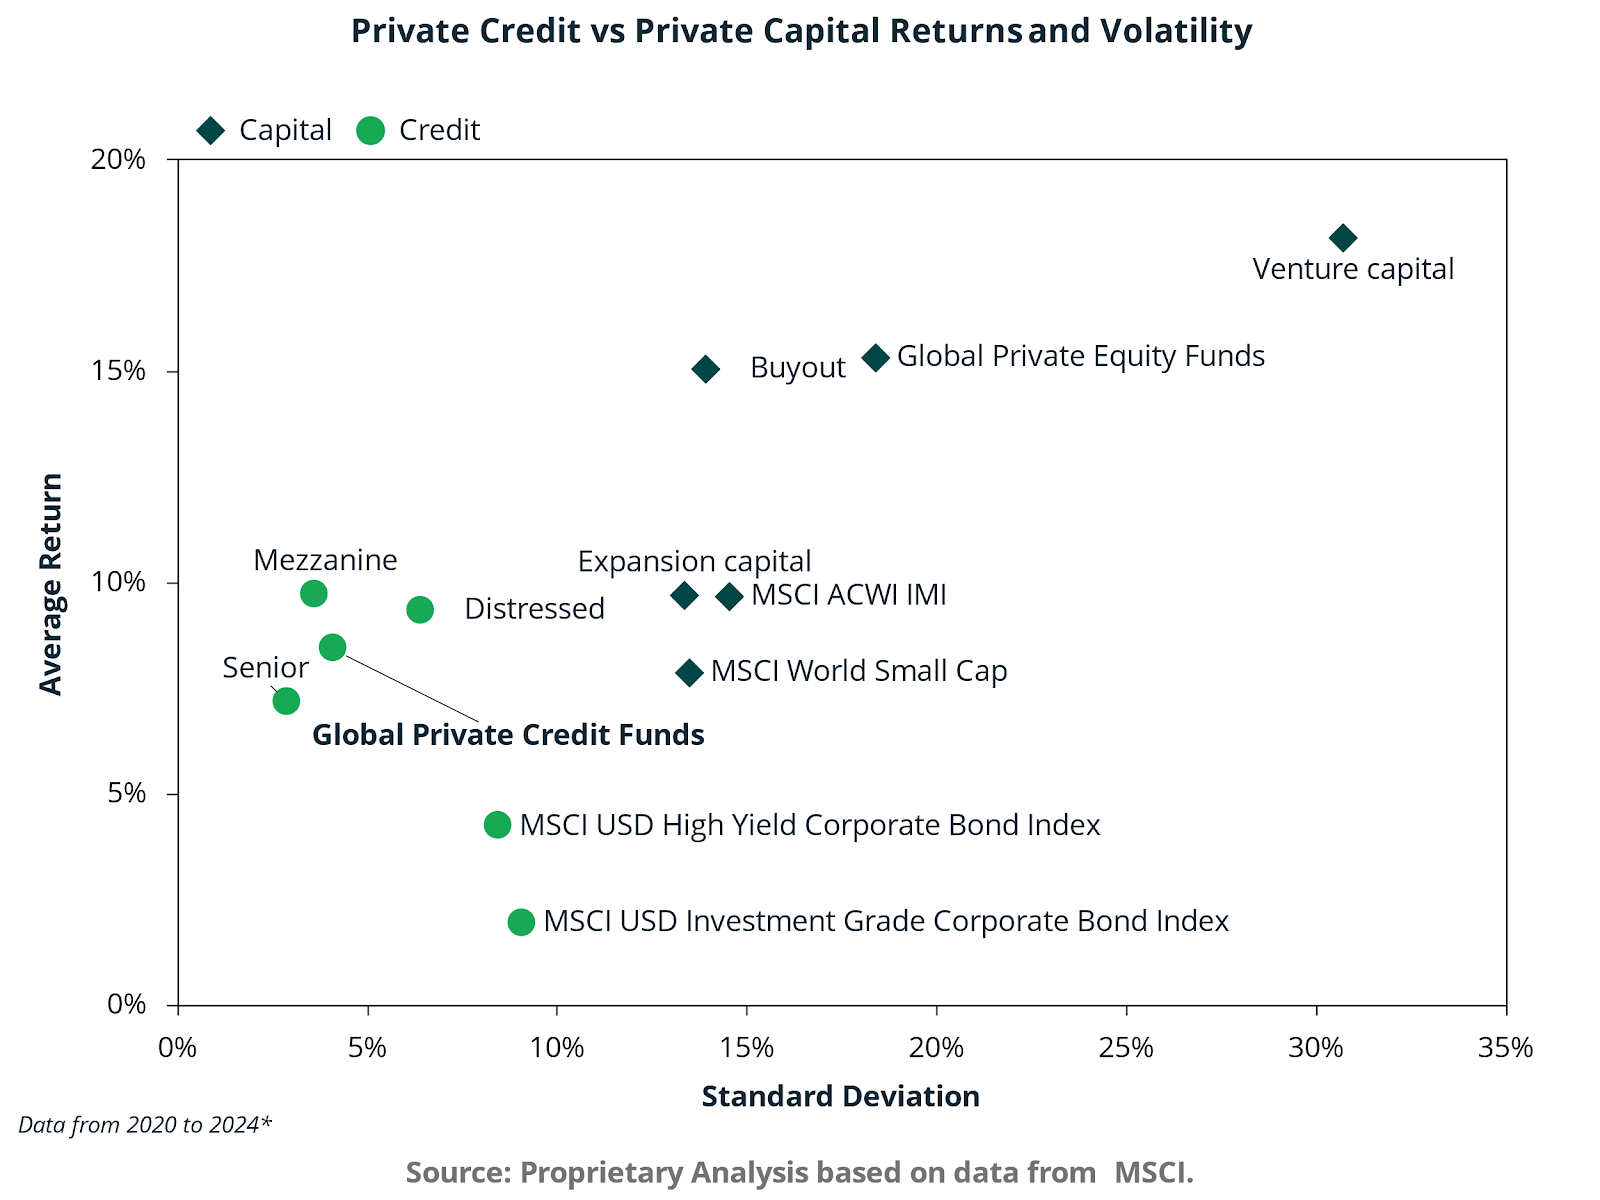
On a return versus volatility scatter, global private credit funds cluster around approximately 8- to 9% average return with volatility near 4- to 6%. Private equity buyout strategies exhibit returns near 15 % with volatility closer to 14%, and venture capital shows even higher dispersion with volatility above 30%.
This positioning indicates that private credit occupies a middle ground between fixed income and private equity, delivering enhanced returns relative to public bonds while maintaining materially lower volatility than equity-oriented private capital.
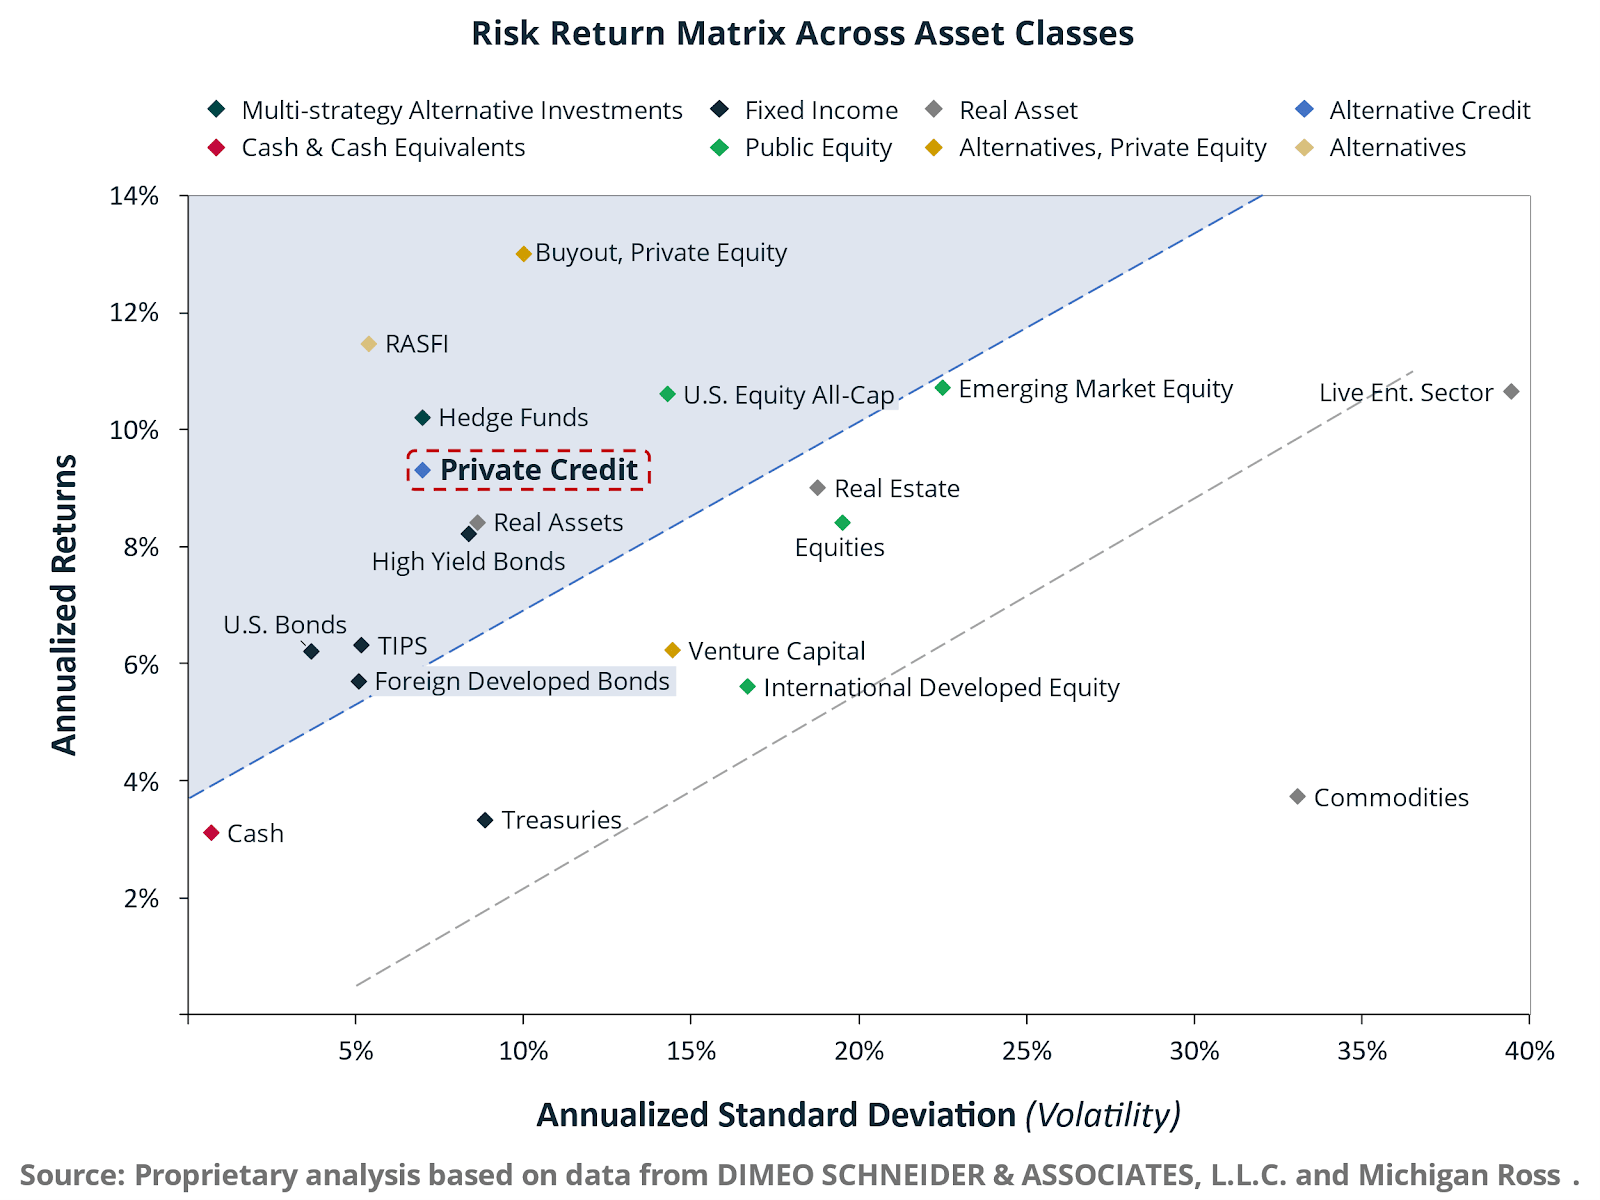
A broader risk-return matrix confirms the role of private credit as an alternative credit anchor. With annualized returns near 9% and volatility around 6%, private credit sits above traditional bonds and below equities on the risk spectrum yet offers higher returns than many public fixed income instruments. Compared with US bonds, Treasuries, and cash, private credit provides significantly higher income. Compared with buyout and venture capital, it offers lower return potential but substantially reduced volatility.
From an asset allocation perspective, the cumulative evidence supports the view that private credit has evolved into a core income-generating asset class with attractive risk-adjusted characteristics, defensive properties during rate shocks, and structurally enhanced recovery outcomes.
Liquidity Profile and Maturity Wall
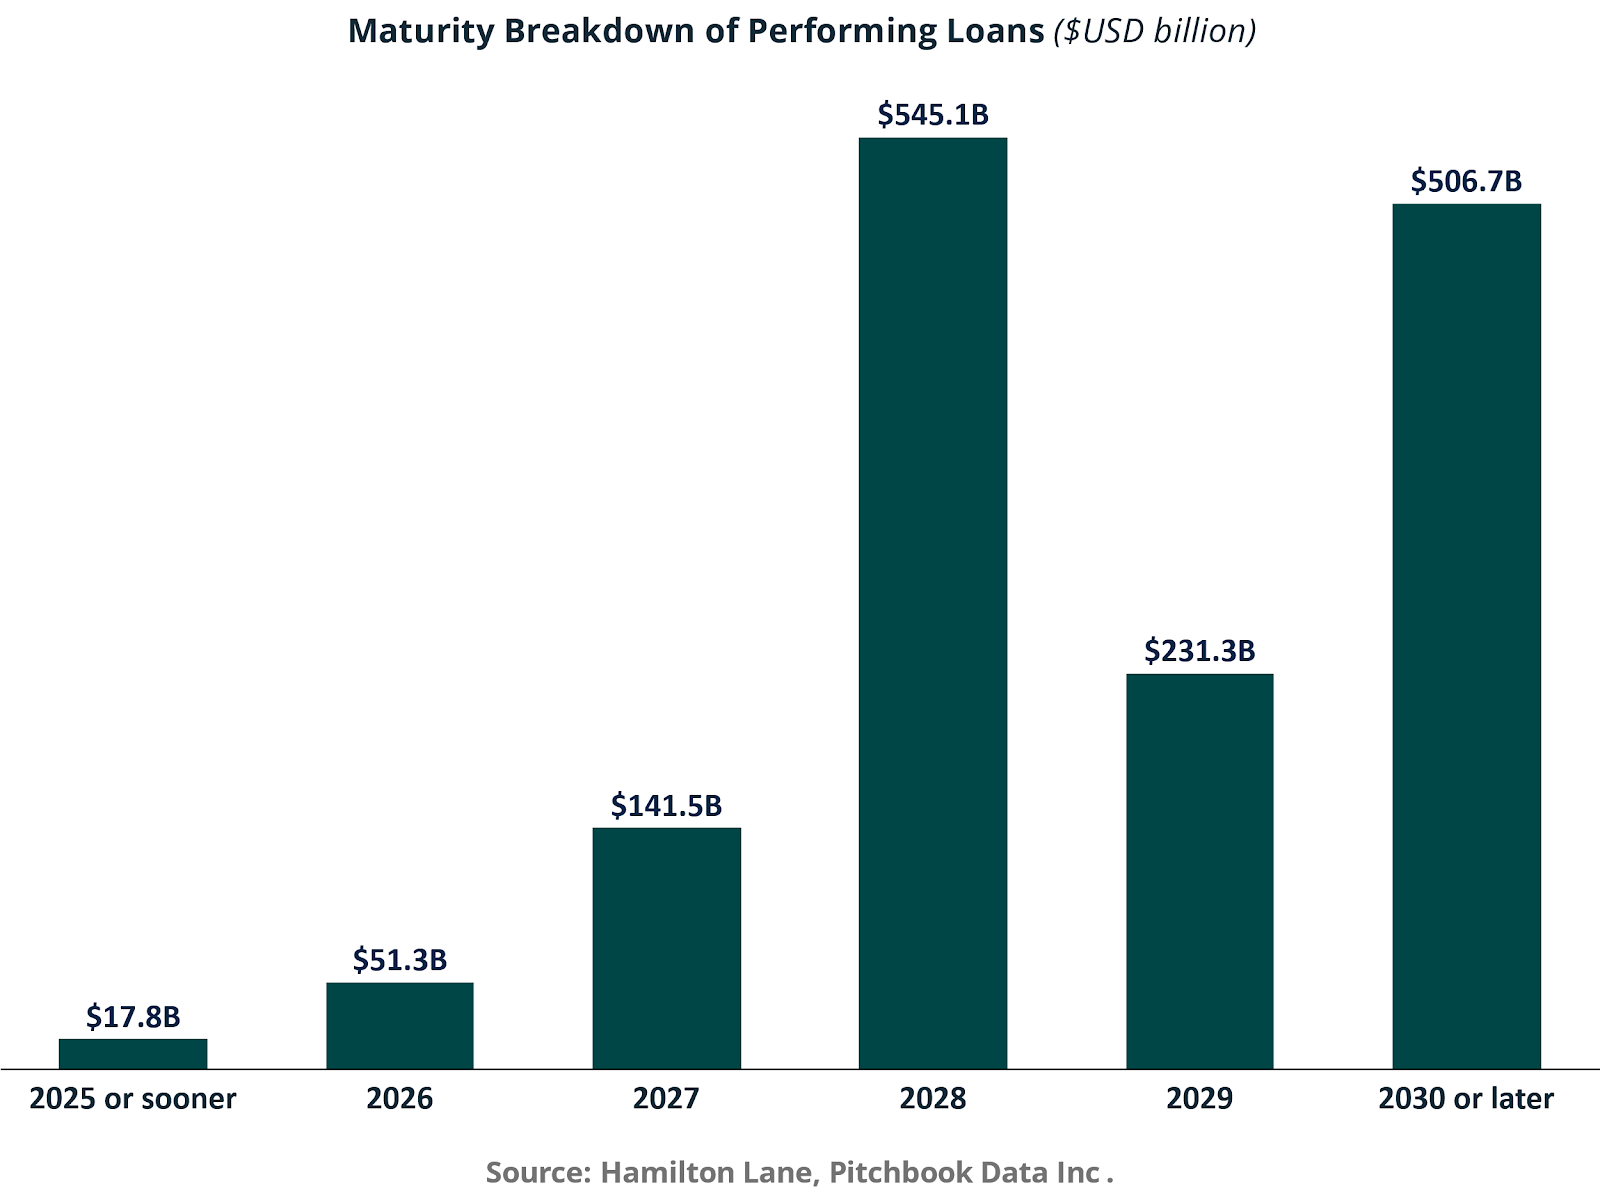
The forward maturity schedule of performing private credit loans highlights a manageable refinancing profile over the next several years. Only $17.8 billion matures in 2025 or sooner, followed by 51.3 billion in 2026 and 141.5 billion in 2027. The maturity wall becomes more pronounced in 2028 at 545.1 billion and remains elevated with 231.3 billion in 2029 and 506.7 billion in 2030 or later.
From a capital markets perspective, this distribution implies limited near-term refinancing pressure relative to the total outstanding stock. The concentration in 2028 and beyond provides managers with a multi-year runway to address capital structure optimization, liability management exercises, and potential extension transactions. In a higher rate environment, the staggered maturity ladder reduces forced asset sales and mitigates systemic rollover risk, particularly given the bilateral and club-oriented nature of private credit underwriting.
The long-dated profile also reinforces the structural illiquidity premium embedded in the asset class. Investors are compensated for duration and limited secondary liquidity, while borrowers benefit from committed capital that is not subject to mark-to-market volatility or public syndication constraints.
Structural Bank Exposure to Private Credit Vehicles
The utilization rate of bank credit lines by private credit vehicles provides insight into liquidity management and balance sheet flexibility. Since 2013, utilization for BDCs has increased from the high 30% range to the mid- to high-50% range by 2024 to 2025. Private debt funds have generally operated in the 55 to 65% range, while other NBFIs have trended more conservatively in the upper 40% to high 50% range.