- PE 150
- Posts
- Evergreen and Continuous Capital: The Evolution of Private Markets Structures
Evergreen and Continuous Capital: The Evolution of Private Markets Structures
Private markets are undergoing a structural shift best understood not as cyclical product innovation, but as a fundamental change in how capital is deployed and maintained over time.

Introduction: From Episodic Capital to Persistent Exposure
The traditional closed-end drawdown model was designed for an environment in which institutional LPs could absorb irregular cash flows, manage liquidity internally, and express exposure through a sequence of discrete vintage-year commitments.
The emergence of evergreen and continuous-capital vehicles reflects a different set of investor constraints. Allocators increasingly seek durable exposure, lower reinvestment friction, and a capital experience that more closely mirrors public markets—while remaining applied to inherently illiquid assets.
In parallel, sponsors face clear economic incentives to stabilize fee revenue, reduce fundraising cyclicality, and extend asset-management franchises beyond the finite life of conventional funds. The relevant economic question, therefore, is not whether evergreen funds are “better” in isolation, but how continuous-capital mechanics alter capital utilization, reinvestment risk, exposure stability, and the realized compounding path of returns.
This report examines that transformation across market adoption, performance evidence, structural design, and asset-class behavior, culminating in a capital-theory framework for why continuous capital represents a structurally superior approach to compounding private-market returns.
Market Adoption and the Structural Scaling of Evergreen Capital

The growth trajectory of unlisted evergreen vehicles indicates that continuous capital has moved well beyond the margins of private markets. Aggregate net AUM increases from approximately $245 billion in 2022 to $302 billion in 2023, $412 billion in 2024, and nearly $493 billion by 2025. This $248 billion expansion over three years implies a compound growth rate in the mid-20% range, materially outpacing traditional closed-end fundraising over the same period.
More revealing than the absolute growth is its underlying composition. Business Development Companies (BDCs) represent the largest contributor, expanding from $49 billion in 2022 to $167 billion by 2025—an absolute increase of $118 billion. Interval funds also scale meaningfully, rising from $59 billion to $126 billion, while tender-offer vehicles grow from $43 billion to $102 billion. In contrast, non-traded REITs remain relatively stable, increasing only modestly from $94 billion to $99 billion. This divergence suggests that the secular expansion of evergreen capital is being driven less by traditional real estate wrappers and more by structures optimized for private credit, multi-asset private capital, and secondary strategies.
The broader structural implication is that “evergreen” is no longer a single product category but a capital behavior expressed across multiple regulatory and liquidity regimes. From a market-structure perspective, this diffusion is critical: it demonstrates that continuous capital is not reliant on the success of a single format, but is instead being adopted across a range of channels—from retail-oriented interval funds to institutionally scaled BDCs—reinforcing its durability as a long-term capital model.
Product Proliferation and Institutionalization

The rapid increase in the number of active evergreen vehicles confirms that asset growth has been accompanied by a corresponding expansion in product supply. The universe grows from 131 funds in 2018 to more than 500 by 2025, with a pronounced acceleration after 2021. Approximately 60 new vehicles are added between 2021 and 2022, nearly 70 between 2022 and 2023, another 68 from 2023 to 2024, and more than 90 between 2024 and 2025.
This rate of proliferation carries two important implications. First, evergreen funds are no longer experimental structures limited to early adopters; they are now being systematically replicated across sponsors and service providers, signaling institutional maturation in valuation methodologies, liquidity management, and operational reporting. Second, as structural familiarity increases, competition among evergreen products shifts away from format novelty toward execution quality—particularly in portfolio construction discipline, redemption mechanics, and liquidity sleeve design.
From an institutional capital perspective, the expanding product set also reflects a broader realignment in distribution. As private markets continue to penetrate wealth platforms and semi-liquid channels, the traditional closed-end commitment model becomes increasingly misaligned with investor behavior. Evergreen vehicles compress the temporal gap between investor intent and capital deployment, a feature that is becoming essential in distribution-driven private capital markets.
Continuation Funds and the Economics of Extended Compounding

Continuation funds occupy a pivotal intermediate position in the progression toward continuous capital. While they are not evergreen vehicles in a subscription-and-redemption sense, they operationalize the same underlying economic logic: extending the compounding horizon by separating asset duration from fund duration. Assets are transferred from a legacy vehicle into a newly formed continuation structure, capitalized by a combination of new investors and rolling LPs from the original fund.
From an economic standpoint, continuation vehicles transform what would otherwise be a terminal liquidity event into an internal reinvestment decision. They enable sponsors to avoid forced realizations in unfavorable market conditions while providing LPs with an explicit choice between liquidity and continued exposure. In this role, continuation funds act as an endogenous liquidity mechanism for private markets, particularly when IPO and M&A exit channels are constrained.
The governance implications, however, are material. With the GP effectively positioned on both sides of the transaction, pricing rigor, valuation independence, and conflict management become decisive factors in determining whether extended compounding accrues to investors or simply reinforces sponsor economics. Within the broader continuous-capital narrative, continuation funds illustrate how the industry is engineering mechanisms to preserve compounding continuity even within the legal confines of closed-end fund structures.
Capital Behavior Across Fund Structures

The timeline illustrates the core economic friction that continuous capital is designed to address: interruptions in compounding driven by idle capital and reinvestment gaps. Syndication structures, while effective for single-asset exposure and high-conviction underwriting, impose episodic compounding at the investor level. Upon realization, capital exits the return stream and remains idle until redeployed, placing full reinvestment responsibility on the investor.
Drawdown funds partially mitigate this issue through portfolio diversification, but introduce a different form of discontinuity. Capital is committed upfront yet deployed over time, while distributions recycle capital back to LPs, reintroducing idle periods unless pacing and liquidity are actively managed. In this model, maintaining capital continuity becomes an operational challenge borne by the investor.
Continuous-capital vehicles reverse this dynamic by internalizing reinvestment within the fund structure itself. By minimizing stop-start capital behavior, they allow capital to remain persistently exposed to productive assets. In financial terms, this represents a transition from discrete investment episodes to a continuous exposure process with materially reduced reinvestment timing risk. The structure does not eliminate risk; rather, it reallocates risk away from capital-path dependency toward underlying asset performance—where risk is more economically relevant and more effectively managed.
Compounding at the Portfolio Level
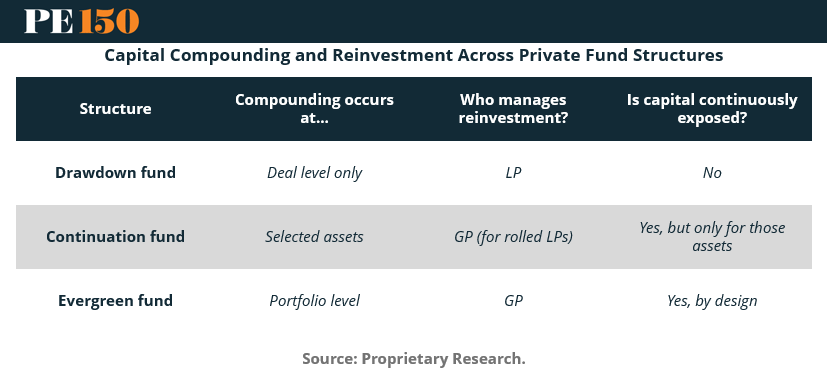
The table clarifies where compounding occurs across fund structures. In drawdown funds, compounding takes place at the individual deal level, with reinvestment decisions effectively outsourced to LPs. Continuation vehicles extend compounding for selected assets under GP control, allowing rollover investors to maintain exposure beyond the original fund’s term. Evergreen funds, by contrast, compound at the portfolio level, with reinvestment managed centrally by the GP.
This distinction is critical because it disentangles asset-level return dispersion from capital-path dispersion. Traditional performance analysis frequently conflates these effects, attributing outcome differentials primarily to manager selection.
In practice, the consistency with which capital remains exposed to assets is an independent determinant of realized returns. Portfolio-level compounding reduces sensitivity to the timing of exits and redeployments, making outcomes more reflective of the GP’s ongoing allocation and reinvestment policy. That policy may succeed or fail, but it is at least centralized, intentional, and engineered for continuity—rather than emerging incidentally from the overlapping lifecycles of multiple closed-end funds.
Performance and Risk: Structural Evidence

The comparative simulation of an evergreen fund, a single drawdown fund, and a rolling sequence of drawdown funds offers the clearest evidence of structural effects on performance. The single drawdown fund generates a mean annual return of 6.5%, primarily because only 28.7% of committed capital is invested on average, with the balance effectively held in cash. This outcome reflects inefficient capital utilization rather than weak underlying asset performance.
Both the evergreen fund and the rolling drawdown series maintain average investment levels near 90% and exhibit an equivalent mean beta of 0.91. Despite this parity, performance diverges: the evergreen structure produces a 13.5% mean annual return versus 12.7% for the drawdown series. The differentiating factor is exposure stability. By construction, the evergreen fund exhibits zero volatility in its invested fraction, while the drawdown series experiences nearly 20% volatility in percent invested over time.
Even with identical average exposure, fluctuations around the target allocation introduce a compounding drag that reduces geometric returns. The higher estimated alpha observed in the evergreen structure is therefore not attributable to superior asset selection, but to superior capital continuity and reinvestment efficiency.
Return and Volatility Trade-Offs

The return–volatility comparison reinforces this interpretation. The evergreen structure delivers a mean return of 13.5%, more than double the 6.5% generated by a single drawdown fund—a differential driven almost entirely by disparities in capital deployment rather than asset performance. Volatility increases from 2.2% to 5.0%, but this rise is a mechanical consequence of continuous exposure to private asset returns instead of intermittent allocations to cash.
For allocators, this reframes the notion of risk. Evergreen funds may appear “riskier” on a volatility metric, yet they are economically more efficient at converting committed capital into invested capital, and invested capital into compounded capital. In this context, higher volatility reflects sustained engagement with the return-generating engine rather than any deterioration in underlying asset quality.
Asset-Class Behavior Within Evergreen Structures

The dispersion in five-year indexed returns across evergreen vehicles underscores that “evergreen” is not an asset class, but a structural wrapper applied to a wide range of underlying strategies. Even so, consistent patterns emerge. Private credit and secondary strategies tend to exhibit smoother, more steadily accretive return profiles than more cyclically exposed segments such as real estate, reflecting differences in cash-flow predictability, deployment speed, and reliance on exit markets.
The implication is that evergreen structures are most economically coherent where reinvestment is structurally feasible and where time out of the market translates directly into foregone return, as is typically the case in credit-oriented strategies.
In contrast, equity strategies—where realizations are often binary and deployment capacity is episodic—derive more conditional benefits from continuous capital, with outcomes increasingly dependent on manager discipline, pacing control, and the consistency of opportunity flow.
Category-Level Performance and Structural Feasibility

At the category level, secondaries lead with approximately 68.7% cumulative growth over the period, followed by private debt at 56.1%, private capital overall at 44.7%, and real estate at 21.7%. This ordering is economically intuitive in a post-2020 environment defined by higher interest rates, constrained exit markets, and increased dispersion in asset quality.
Within this context, performance outcomes function as feasibility indicators for evergreen structures. Strategies characterized by efficient reinvestment dynamics and predictable cash generation are structurally better aligned with vehicles that offer periodic liquidity and continuous compounding.
The evidence suggests that the adoption and success of evergreen capital have been concentrated in categories where wrapper mechanics and underlying cash-flow profiles reinforce one another, rather than conflict.
Volatility, Valuation, and Risk Interpretation

The volatility data adds important nuance to the risk discussion. Volatility varies meaningfully across categories and over time, reflecting both underlying economic conditions and differences in valuation methodology. In 2021, real estate volatility peaks near 6.5%, while in 2022 volatility compresses across categories, likely due to valuation smoothing during a period of market stress. By 2024, dispersion reemerges, with secondaries and private debt exhibiting higher volatility than real estate.
The central takeaway is that volatility in evergreen vehicles should not be interpreted mechanically. Because NAV-based reporting dampens high-frequency price movements, apparent stability may obscure underlying economic risk. As a result, evergreen risk must be assessed in conjunction with liquidity terms, valuation governance, and stress-period behavior, rather than inferred directly from reported volatility alone.
Conclusion
Traditional performance metrics such as IRR implicitly assume that capital is continuously at work. They are largely silent on the periods before deployment and after distributions, when capital frequently sits idle or earns materially lower returns. The analysis in this report makes that blind spot explicit. A single drawdown fund produces a 6.5% mean return because only 28.7% of capital is invested on average, whereas an evergreen structure maintains approximately 90% investment with a stable exposure path and therefore achieves a 13.5% mean return under identical asset assumptions.
Even when a rolling series of drawdown funds is engineered to reach a comparable average investment level, volatility in the invested fraction introduces a compounding drag that reduces geometric returns. This is the core economic rationale for continuous capital. It does not generate alpha in isolation; rather, it preserves the conditions under which alpha can compound by minimizing idle capital and reinvestment friction.
In environments characterized by sufficient deployment capacity and strong governance, continuous-capital structures represent a rational evolution of private markets. They convert private investing from episodic exposure into persistent exposure and reframe the allocator’s challenge from managing cash-flow timing to evaluating manager skill, portfolio construction, and liquidity design. In this sense, continuous capital is not simply a product category, but a structural solution to the problem of compounding private returns efficiently in an inherently illiquid market.
Sources & References
CFA Institute. (2021). Permanent Capital: The Holy Grail of Private Markets. https://blogs.cfainstitute.org/investor/2021/06/01/permanent-capital-the-holy-grail-of-private-markets/
EQT. (2025). The Rise of Continuation Funds in Private Equity. https://eqtgroup.com/thinq/private-markets/continuation-funds-private-equity
Moonfare. (2025). Continuation fund. https://www.moonfare.com/glossary/continuation-fund
Morningstar. https://www.morningstar.com/company
PitchBook. (2025). US Evergreen Fund Landscape. https://pitchbook.com/news/reports/q4-2025-us-evergreen-fund-landscape
SG Analytics. (2025). Evergreen Funds in 2025: Growth, Gaps, and the Case for Caution. https://www.sganalytics.com/blog/evergreen-funds-growth-gaps-and-caution/
White Case. (2022). Continuation funds emerge as attractive options for PE fund managers and investors. https://www.whitecase.com/insight-our-thinking/managing-volatility-considerations-taiwan-continuation-funds-emerge-attractive-options-pe
Premium Perks
Since you are an Executive Subscriber, you get access to all the full length reports our research team makes every week. Interested in learning all the hard data behind the article? If so, this report is just for you.
|
