- PE 150
- Posts
- Why Real Estate Outperforms Gold as an Inflation Hedge
Why Real Estate Outperforms Gold as an Inflation Hedge
While many economists highlight broader disinflationary trends and anticipate easing inflation in the second half of 2026, shelter inflation continues to exceed the headline rate.

Why Real Estate Outperforms Gold as an Inflation Hedge
Inflation
Inflation in the real economy is neither theoretical nor evenly experienced. It emerges first—and lingers longest—in essential categories such as housing, food, utilities, and services before spreading into discretionary spending. The December 2025 CPI report illustrates this dynamic clearly. Headline inflation held steady at 2.7% year over year, unchanged from November, but that apparent stability conceals continued pressure in core household expenses. Food prices, both at home and dining out, climbed 0.7% month over month. Utility gas prices jumped 4.4% in a single month and more than 11% year over year. These are not speculative or volatile segments; they are foundational components of everyday living costs.
More critically, inflation remains most persistent where it has the greatest long-term impact: shelter. While many economists highlight broader disinflationary trends and anticipate easing inflation in the second half of 2026, shelter inflation continues to exceed the headline rate. This persistence reflects the structural rigidity of housing markets. Unlike goods, which can see rapid price declines due to discounting, excess inventory, or shrinking margins, rents and housing costs adjust slowly and unevenly. When they rise, they rarely retrace quickly—and often not at all.

Housing represents the largest share of the CPI basket, accounting for more than 40% of the index. Consequently, inflation is not simply affected by housing costs; it is fundamentally anchored by them. Any rigorous framework for inflation hedging must therefore start with housing rather than commodities or abstract financial instruments.
Shelter’s persistent role is evident in the latest CPI data. In December 2025, shelter prices increased 0.4% month over month and 3.2% year over year, exceeding both headline CPI and core goods inflation. Even as energy prices softened and apparel inflation remained subdued, shelter continued to apply upward pressure on the index. This dynamic helps explain why inflation often feels more entrenched to households than the headline figures imply: rents adjust gradually on the way up—and even more slowly on the way down.

The expenditure breakdown reinforces why inflation feels concentrated and persistent at the household level. Housing alone accounts for roughly 33% of total spending, making it by far the largest single category in a typical U.S. household budget. When combined with other essentials—food (13%), transportation (17%), healthcare (8%), and utilities embedded within housing and services—well over half of household expenditures are tied to necessity-based categories. These are precisely the segments where inflation tends to appear first and remain longest. By contrast, discretionary areas such as entertainment (5%), education (2%), and miscellaneous spending (7%) represent a much smaller share of the consumption basket. This composition explains the disconnect between headline inflation readings and lived experience: when prices rise in categories that dominate household budgets, even modest percentage increases translate into sustained financial pressure.

Real Estate
Real estate functions within the inflationary framework rather than reacting to it from the periphery. Housing costs are not merely correlated with inflation; they are embedded in both its statistical construction and its everyday impact.
Over extended periods, this structural position enables real estate to reprice methodically as wages increase, construction inputs become more expensive, and replacement costs rise.
The long-term trajectory of housing prices makes this dynamic evident. Over the past decade, U.S. home prices have risen by roughly 101%, substantially outpacing cumulative inflation during the same period.
This appreciation unfolded across diverse economic environments—including low-inflation cycles, phases of monetary tightening, and the post-pandemic normalization of prices. Housing does not typically respond to short-term inflation fears; it responds to structural supply limitations and sustained growth in nominal incomes.

Income-producing real estate extends this inflation linkage beyond asset valuation and into recurring cash flow. Unlike assets that rely primarily on price appreciation, income-generating properties produce contractual rental streams that can adjust over time. Public real estate, as represented by the FTSE Nareit U.S. Real Estate Index, has compounded meaningfully since the early 1970s. That long-run performance is not simply a function of rising property prices; it reflects the cumulative effect of rental income that is collected, distributed, and reinvested across multiple economic cycles.
This distinction matters. Rental income tends to adjust gradually alongside wage growth, operating costs, and replacement values. In inflationary periods, landlords can often reset rents upward as leases renew, particularly in supply-constrained markets. In disinflationary or low-inflation environments, properties continue to generate cash flow even if nominal price growth moderates. The compounding effect therefore operates in both regimes: appreciation contributes during periods of nominal expansion, while income provides continuity when price growth slows.
Real estate does not require abrupt inflation spikes to justify its role in a portfolio. Instead, it functions within the broader nominal economy. When inflation rises, higher construction costs and replacement values can support asset prices and rent growth. When inflation recedes, ongoing income generation sustains returns. Over long horizons, it is this combination—embedded pricing power and recurring cash flow—that underpins real estate’s durability as an inflation hedge.

Importantly, this long-term performance has been achieved with volatility that is moderate relative to the returns generated. Since 1971, real estate has produced approximately 9% annualized returns, accompanied by volatility in the range of 15–16%. Over the past decade, volatility has declined meaningfully even as total returns remained positive, reflecting a more mature and institutionally integrated asset class.
This relative stability is structural rather than coincidental. Recurring rental income provides a steady component of total return, dampening the impact of short-term price fluctuations in public markets. At the same time, the widespread use of fixed-rate, long-duration debt introduces an embedded advantage during inflationary periods.
As nominal incomes and property values rise, the real burden of existing debt declines, effectively transferring value from creditors to equity holders. Over time, this dynamic enhances real equity value and reinforces the compounding effect that distinguishes income-producing real estate from purely price-dependent assets.

Gold
Gold occupies a distinctly different role in the inflation framework. Unlike real estate, it is not embedded within the structure of the real economy, nor is it directly tied to wage growth, production costs, or consumption patterns. Instead, gold functions primarily as a monetary asset—one whose price responds to perceptions of currency debasement, financial stress, and institutional credibility. Its relationship to inflation is therefore indirect and episodic rather than structural and continuous.
Across centuries, gold has served as a store of value during periods of acute monetary disruption. However, its history is characterized less by steady compounding and more by discrete repricing events. Major advances in gold prices have tended to coincide with regime shifts: the breakdown of monetary systems, sharp currency devaluations, or crises of confidence in financial institutions. These episodes produce powerful upward moves, but they are intermittent and often followed by prolonged periods of stagnation in real terms.
The long-term price record makes this clear. For extended stretches, gold has delivered little real return after adjusting for inflation, remaining broadly flat in purchasing-power terms. Its most significant appreciation occurred following the collapse of the Bretton Woods system in 1971 and during subsequent periods of macroeconomic stress. In this sense, gold responds less to realized inflation itself and more to expectations about monetary credibility, policy uncertainty, and systemic instability. It is a hedge against crisis psychology rather than a mechanism that compounds alongside the nominal economy.

Gold’s return profile reinforces these structural limitations. While the metal has produced strong gains over certain discrete periods—most notably in the last decade—its long-term compounded returns are modest relative to income-producing assets. The chart illustrates this dispersion clearly. Over its full historical record, gold generated approximately 2.9% annualized returns. Even over the past 100 years, returns averaged only about 5.5% annually. Following the breakdown of the gold standard in the early 1970s, performance improved, with gold returning roughly 8.5% since 1972 and about 9.0% since 1971. In the 21st century, annualized returns rose to approximately 11.6%, and over the last decade, they reached roughly 14.1%.
However, these higher returns came with substantial volatility. Across all historical periods shown, gold’s price fluctuations have remained elevated. Long-term volatility has hovered near 14.8%, rising to roughly 19.9% over the past century. Since 1972, volatility has averaged approximately 25.1%, with similarly high levels of 23.3% since 1971. Even in the 21st century, volatility remained near 18.6%, and over the last decade it measured roughly 23.5%. In other words, gold’s strongest return windows have coincided with pronounced price swings, exposing investors to meaningful drawdowns and extended periods of stagnation between rallies.

Gold’s defining feature as an inflation hedge is that it generates no internal cash flow. It does not adjust rents, refinance liabilities, or produce income that can be reinvested during inflationary periods. Its return is entirely dependent on market repricing.
To realize value, an investor must sell at the prevailing market price, which may or may not reflect favorable conditions at that time.
In the case of physical gold, additional frictions compound this limitation. Storage, insurance, and custody costs reduce net returns over time. Liquidity often depends on intermediaries—banks, vault operators, or dealers—whose services are neither costless nor frictionless.
As a result, gold’s performance is episodic and sentiment-driven, lacking the embedded, income-generating mechanism that allows real estate to compound steadily within the inflation system itself.
Real Estate vs. Gold
The divergence between real estate and gold becomes most visible when examined across full monetary regimes rather than isolated cycles.
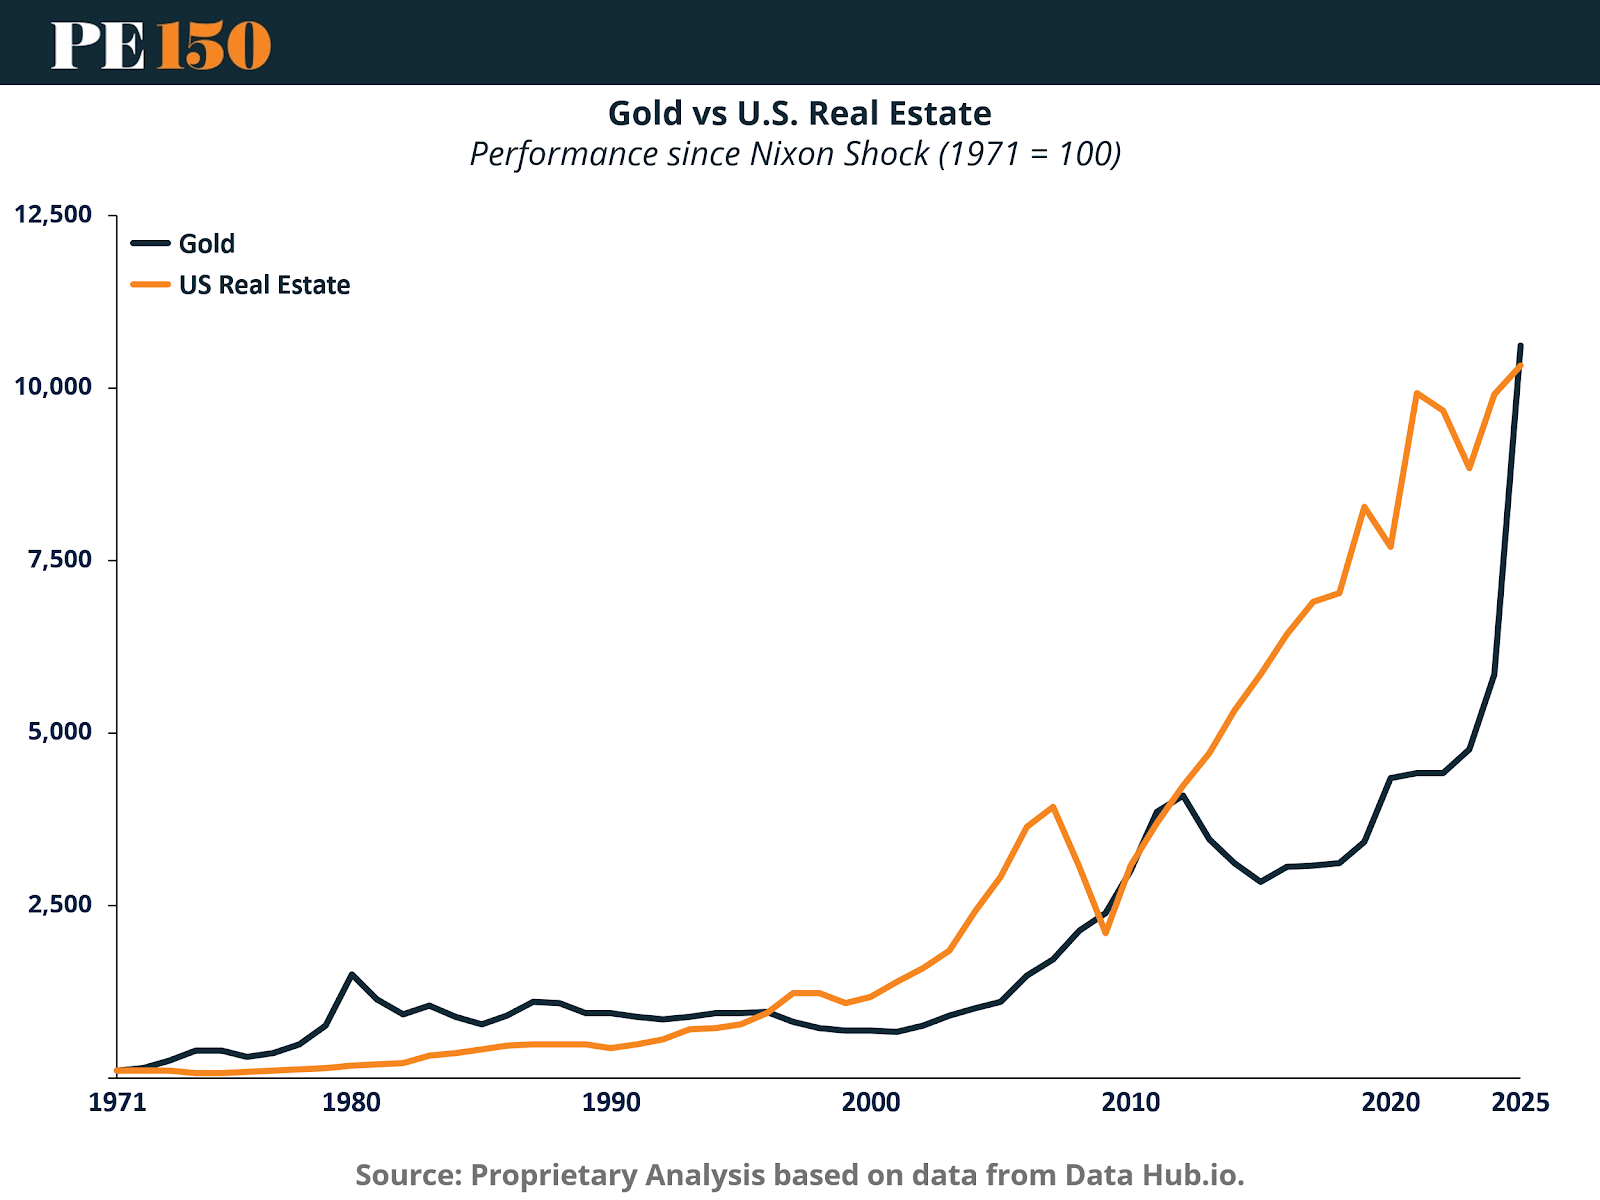
Since the collapse of Bretton Woods in 1971, both assets have operated within a fiat currency system. However, their return paths have been structurally different. From a base of 100 in 1971, both gold and U.S. real estate appreciated substantially, but real estate’s trajectory has been markedly smoother and more consistently compounding.
While gold experienced powerful surges—most notably in the late 1970s, post-2008, and again in the early 2020s—these advances were separated by long stretches of stagnation or drawdowns. Real estate, by contrast, exhibited cumulative growth tied to rents, replacement costs, and income expansion. By 2025, both assets reached roughly five-digit index levels, but real estate achieved that level through steadier compounding rather than episodic repricing.
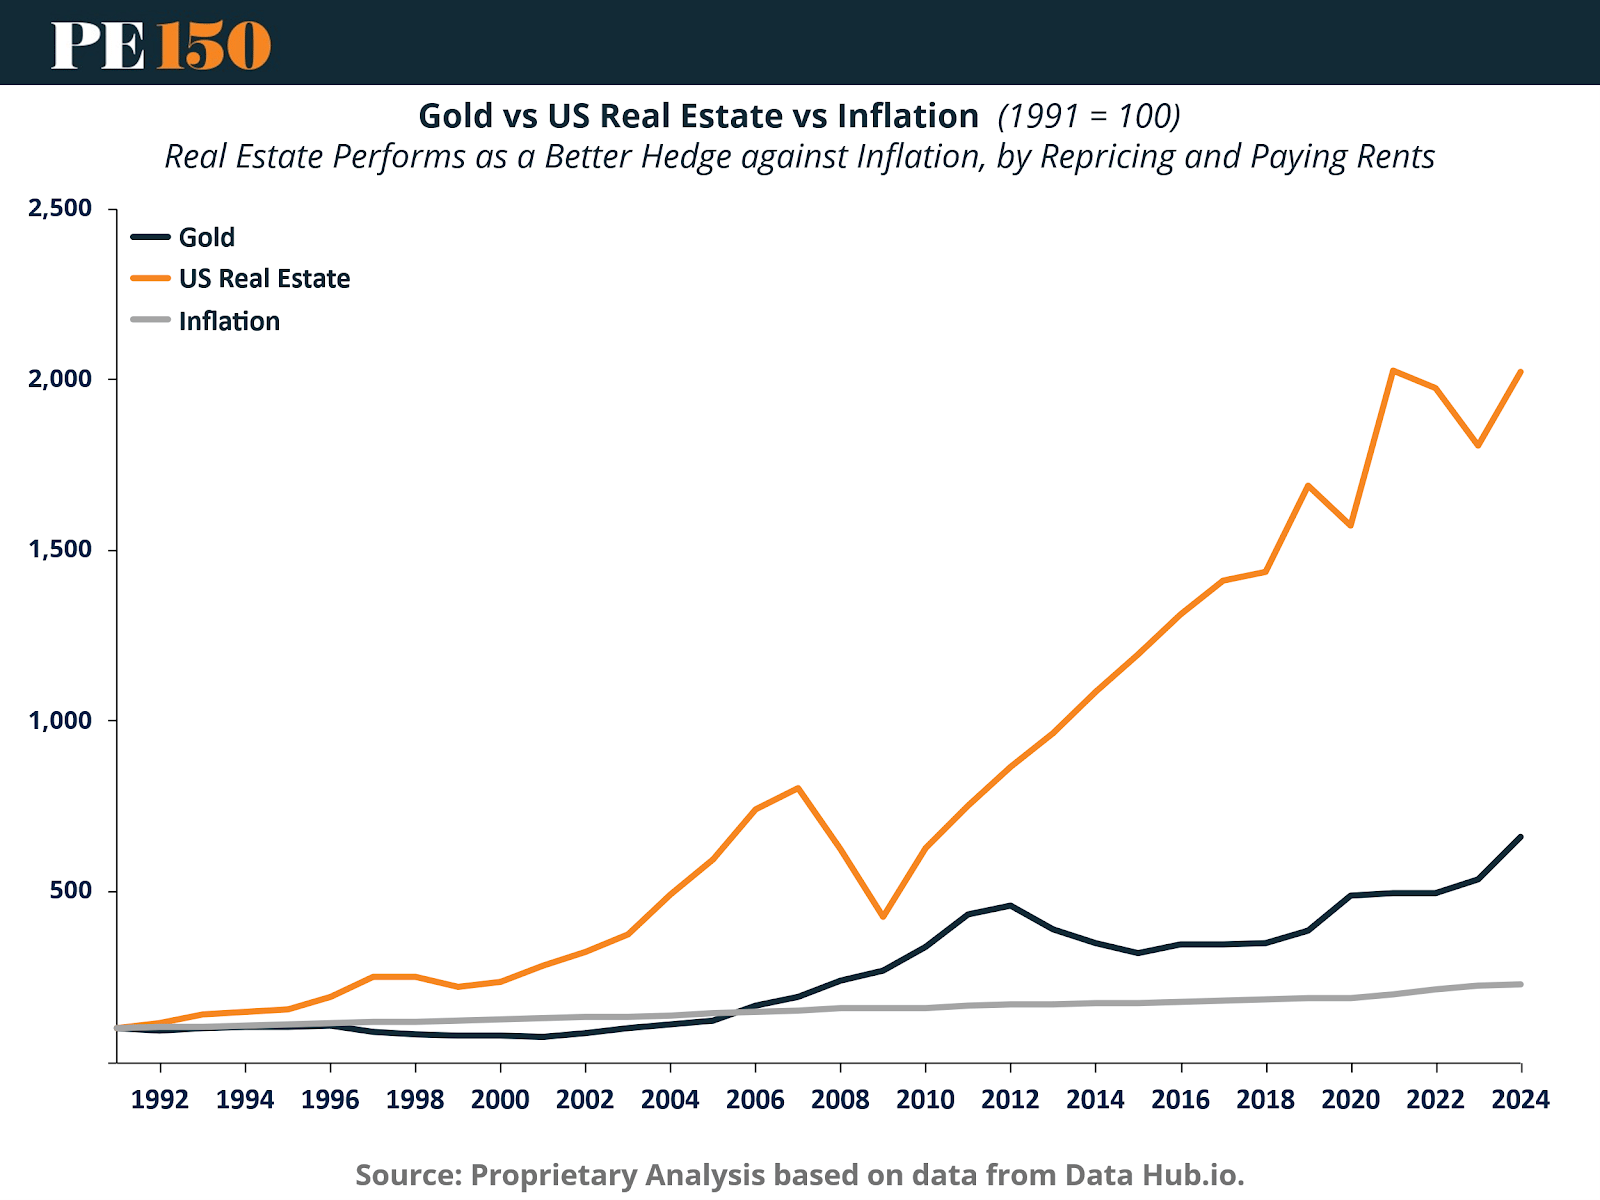
When inflation is explicitly incorporated, the distinction sharpens further. Since 1991, inflation increased modestly relative to both assets, rising to roughly ~220 on the index scale by 2024. Gold rose to approximately ~650 over the same period, meaning it preserved purchasing power and modestly exceeded inflation.
Real estate, however, compounded to approximately ~2,000 on the same index base—nearly three times gold’s level and dramatically ahead of cumulative inflation. Importantly, this outperformance occurred while distributing rental income throughout the period. Real estate did not merely track inflation; it repriced alongside it while simultaneously generating cash flow.
Gold’s performance, while positive in nominal terms, did not exhibit the same internally compounding structure. Its gains were largely driven by macro stress episodes rather than embedded economic cash flows.

Risk metrics reinforce the structural difference. Since 1971, gold delivered a 9.02% CAGR with 24.9% volatility, while real estate generated a comparable 8.97% CAGR with materially lower volatility at 15.7%. During the globalization period (1990–2025), real estate outperformed outright: 9.58% CAGR versus gold’s 7.17%, again with lower volatility (15.5% vs. 17.6%).
In the 21st century, gold slightly exceeded real estate in CAGR (11.59% vs. 9.13%), but did so with higher volatility (18.6% vs. 15.9%). Over the last decade, gold’s returns accelerated to 14.07%, but volatility climbed to 23.5%, more than double real estate’s 10.5% volatility, despite real estate’s still positive 5.86% CAGR. The pattern is consistent: gold can deliver strong returns, but it does so with materially greater price dispersion.

When returns are normalized by volatility, real estate’s efficiency becomes clearer. Since 1971, real estate produced a CAGR/volatility ratio of 56.94%, compared with gold’s 36.28%. From 1990 onward, the spread widened further: 61.71% for real estate versus 40.83% for gold. Even in the last decade—gold’s strongest return window—real estate maintained competitive risk efficiency (55.82%) relative to gold (59.90%), but with significantly lower absolute volatility.
Across longer horizons, real estate consistently converts each unit of risk into more stable compounded return.

The compounding mechanism becomes visually intuitive when modeled over a ten-year horizon. A $10,000 investment in a linear gold return path grows steadily but modestly, reaching roughly ~$21,500 over 120 months in the illustration.
In contrast, a compounding real estate structure reaches approximately ~$27,500 over the same period. The difference is not merely magnitude but structure: real estate reinvests income and compounds internally, while gold’s return path remains price-dependent and linear.
Structural Conclusion
Across full monetary cycles, inflation-adjusted comparisons, and risk-normalized frameworks, the divergence is consistent. Gold responds to monetary instability and investor psychology. Real estate participates directly in the nominal economy—repricing rents, compounding income, and benefiting from balance-sheet asymmetry through fixed-rate debt.
Over long horizons, real estate transforms inflation into both distributable income and equity appreciation. Gold transforms uncertainty into episodic price appreciation. The distinction between compounding cash flows and sentiment-driven repricing ultimately explains the persistent performance gap.
Sources & References
Bureau of Labor Statistics. (2026). CONSUMER PRICE INDEX – DECEMBER 2025. https://www.bls.gov/news.release/pdf/cpi.pdf
CNBC. (2026). Here’s the inflation breakdown for December 2025 — in one chart. https://www.cnbc.com/2026/01/13/cpi-inflation-december-2025-breakdown.html
DataHub.io. (2026). Gold Prices. https://datahub.io/core/gold-prices
GoldPrice.com. (2026). Gold Price History. https://goldprice.org/gold-price-history.html
NAREIT. Monthly Index Values & Returns. https://www.reit.com/data-research/reit-indexes/monthly-index-values-returns
Statista. (2025). The Components of the Consumer Price Index. https://www.statista.com/chart/31266/composition-of-the-consumer-price-index/?srsltid=AfmBOooHT6B0_OYOl7YzJ7nxdsdRA98IheDRB_bnffsvXqbkJnyeGPhC
U.S. Bureau of Labor Statistics, Consumer Price Index for All Urban Consumers: All Items in U.S. City Average [CPIAUCSL], retrieved from FRED, Federal Reserve Bank of St. Louis; https://fred.stlouisfed.org/series/CPIAUCSL, January 29, 2026.
U.S. Federal Housing. (2026). FHFA House Price Index Datasets. https://www.fhfa.gov/data/hpi/datasets
Premium Perks
Since you are an Executive Subscriber, you get access to all the full length reports our research team makes every week. Interested in learning all the hard data behind the article? If so, this report is just for you.
|
