- PE 150
- Posts
- Private Equity’s Next Phase
Private Equity’s Next Phase
From Megadeals and Add-Ons to Portfolio Optimization in FY2025–2026

I. Introduction
Global private equity entered FY2025 in a paradoxical position: deal volumes softened, yet capital deployment remained resilient. Through Q3’25, global PE investment reached $1.5 trillion, putting the industry firmly on track to exceed investment levels recorded over the past three years. This momentum has been driven less by broad-based dealmaking and more by a concentrated resurgence of megadeals, as investors prioritize scale, quality, and conviction amid lingering macroeconomic and geopolitical uncertainty. In Q3’25 alone, PE investment totaled $537 billion, surpassing Q3’24 levels despite a sharp decline in deal count—underscoring a market defined by fewer, larger, and more strategic transactions.
Regionally, the Americas—led overwhelmingly by the United States—continued to dominate global PE flows, accounting for over 60% of deal value in Q3’25. A handful of landmark public-to-private transactions materially shaped quarterly outcomes, highlighting how sensitive aggregate investment figures remain to megadeal activity. In contrast, Europe, the Middle East, and Africa (EMA) and Asia posted more modest but steady investment levels, reflecting a more cautious underwriting environment and heightened scrutiny of growth assumptions. Outside of these outsized transactions, PE investors remain selective, targeting assets with durable cash flows, pricing power, and clear operational upside—while deferring broader deployment until uncertainty around trade, geopolitics, and exit conditions further stabilizes.
At the same time, structural shifts are reshaping capital allocation priorities. Cross-border dealmaking rebounded meaningfully in 2025 as firms sought geographic diversification and proximity to end markets in an increasingly fragmented global economy. Sector-wise, AI-linked infrastructure emerged as a standout theme, driving a notable pickup in infrastructure, transport, and energy investment, while TMT retained its position as the largest recipient of global PE capital. Yet challenges persist: exit volumes remain historically low, fundraising activity is subdued, and capital continues to accumulate within the system—placing pressure on GPs to find alternative liquidity paths, including secondaries and continuation vehicles.
Looking ahead to Q4’25 and into 2026, the PE market is positioned for gradual improvement rather than a rapid rebound. Declining interest rates, a tentative reopening of IPO markets in the US and Asia, and expanding government investment in areas such as defense, infrastructure, and technology autonomy are expected to support renewed activity. However, the pace of recovery will hinge on the normalization of exit markets and investor confidence in valuation resets. Against this backdrop, this report examines the key data, sector trends, regional dynamics, and forward-looking signals shaping private equity performance in FY2025—and the implications for capital deployment and returns in 2026.
II. Global Deal Activity: Fewer Deals, Bigger Checks
Global private equity deal activity in FY2025 continues to reflect a structural shift toward value concentration rather than volume expansion. As shown in the chart above, total deal value has remained relatively resilient compared to historical norms, even as deal count remains well below peak levels. After reaching a cyclical high of $2.5 trillion in 2021, global PE investment reset sharply in 2022 and 2023 as higher interest rates, valuation gaps, and macro uncertainty constrained activity. While 2024 marked a modest recovery in capital deployment, FY2025* has so far tracked sideways, with investment levels hovering around $1.5 trillion on a trailing twelve-month basis.
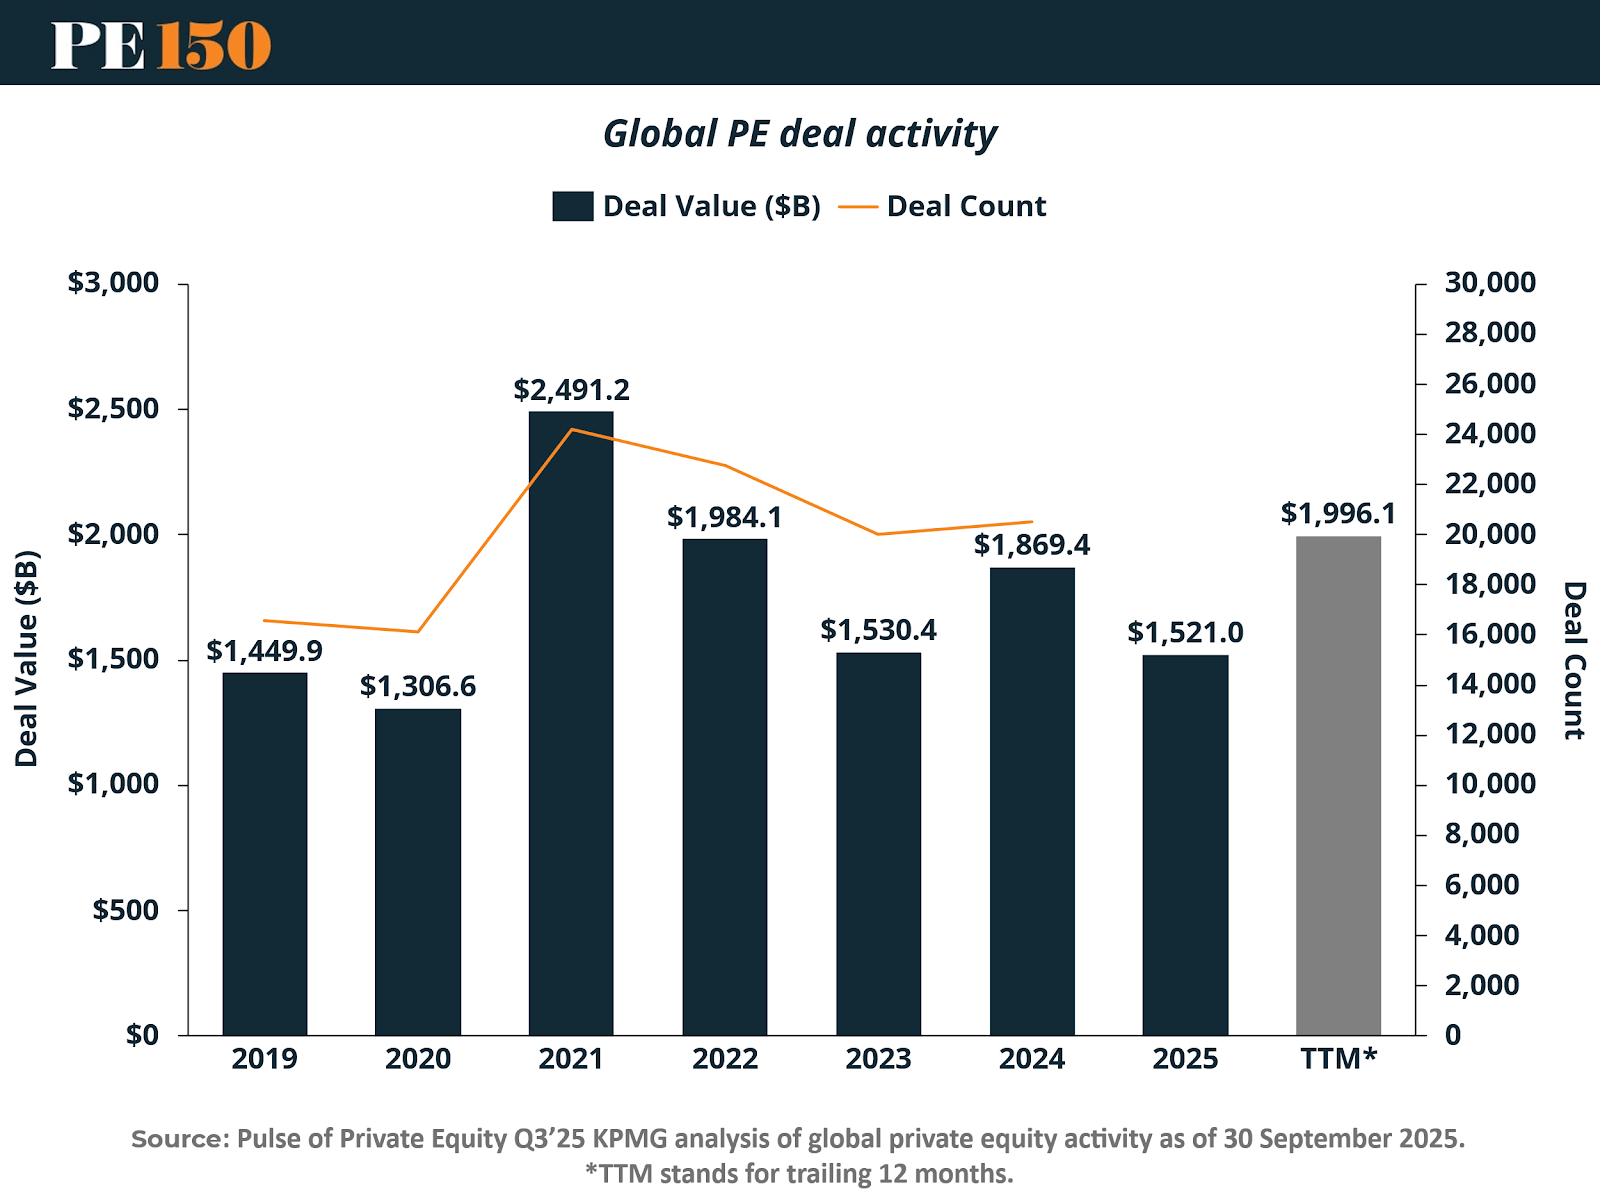
The more notable divergence appears on the volume side. Deal count peaked in 2021 and has declined meaningfully since, with FY2025* remaining well below pre-tightening levels. This persistent gap between deal value and deal volume highlights a market increasingly shaped by large, sponsor-led transactions and public-to-private buyouts, rather than broad-based middle-market activity. A relatively small number of megadeals continues to account for a disproportionate share of total invested capital, masking underlying caution across much of the market.
Importantly, this dynamic suggests that the PE slowdown is not driven by a lack of capital, but by selectivity and risk discipline. Investors are prioritizing transactions where scale, operational leverage, and downside protection justify deployment, while smaller or more speculative opportunities struggle to clear investment committees. Until financing conditions ease further and exit visibility improves, deal volume is likely to remain constrained—even if headline investment figures stabilize or modestly improve.
Looking into 2026, a sustained recovery in deal activity will depend less on capital availability and more on valuation alignment, exit normalization, and confidence in earnings durability. Without a meaningful rebound in deal count, aggregate investment figures will continue to be heavily influenced by episodic megadeals rather than a broad reopening of the PE market.
III. Add-On Deals: Buy-and-Build Remains a Core PE Playbook
Add-on and bolt-on transactions have remained a critical release valve for private equity capital in an otherwise cautious dealmaking environment. As illustrated above, global PE add-on deal value reached an estimated $475 billion in FY2025*, broadly in line with recent years and well positioned to remain one of the most resilient transaction categories across cycles. While activity remains below the 2021 peak—when add-on value approached $775 billion—the strategy continues to offer PE sponsors a lower-risk pathway to growth amid tighter financing conditions.

Deal count trends reinforce this dynamic. Add-on volumes peaked in 2021–2022 at an estimated 11,000–11,500 transactions globally, before moderating to roughly 9,500–10,000 deals in 2023 as valuation uncertainty and integration risk moved back into focus. In 2024, deal count stabilized at approximately 10,000–10,500 transactions, supported by sponsors doubling down on platform expansion in software, business services, healthcare, and technology-enabled sectors. FY2025* volumes appear slightly lower, estimated at ~9,000–9,500 deals, reflecting increased scrutiny of PE-owned targets and more conservative synergy assumptions.
Notably, the character of add-on activity has evolved. Sponsors are no longer pursuing scale for scale’s sake; instead, operational adjacency, margin enhancement, and geographic densification are driving acquisition rationale. Assets owned by other PE firms are facing heightened diligence, with greater emphasis on earnings quality, customer concentration, and integration readiness. As a result, while aggregate add-on investment remains robust, execution risk tolerance has narrowed.
Looking ahead to 2026, add-ons are expected to remain a cornerstone of value creation, particularly as sponsors seek to prepare assets for eventual exits in a still-selective market. However, deal pacing is likely to remain disciplined, with successful buy-and-build strategies increasingly defined by precision and integration quality rather than transaction volume alone.
IV. Buyout Mix: Add-Ons Dominate as Platform Risk Is Repriced

The composition of global PE buyout activity over the past six years highlights a structural reweighting toward add-on and bolt-on transactions, particularly in the post-2021 market environment. As shown above, add-ons have consistently represented the majority of global buyout volume, rising sharply during the 2021–2022 peak and remaining elevated even as overall dealmaking cooled. In contrast, platform buyouts and non–add-on transactions have yet to recover to prior highs, underscoring investor caution around underwriting new standalone platforms.
In 2021, global add-on buyouts surpassed 11,000 transactions, nearly double the volume recorded in 2019. While volumes moderated in 2023 amid tighter financing conditions, add-ons still accounted for roughly 65–70% of total buyout activity, reinforcing their role as the preferred deployment channel in a risk-constrained market. FY2024 saw a modest rebound in add-on volume to just over 10,000 deals, while FY2025* has tracked lower at approximately 8,900 transactions, reflecting continued discipline rather than a wholesale retreat.
Platform buyouts tell a different story. After peaking near 5,600 deals in 2021, platform activity declined steadily through 2023 as valuation gaps widened and exit visibility deteriorated. While 2024 showed early signs of stabilization, FY2025* volumes—estimated at just over 3,100 transactions—remain well below cycle highs. This divergence is particularly notable given the abundance of dry powder in the system, suggesting that capital availability is not the binding constraint; conviction is.
Strategically, this mix shift reflects PE firms’ preference for incremental value creation over binary risk. Add-ons allow sponsors to average entry multiples, deepen operational capabilities, and build scale within familiar platforms, while deferring the risk associated with launching new platforms at uncertain valuations. Looking into 2026, a sustained recovery in platform buyouts is likely to hinge on improved exit markets and greater confidence in earnings durability. Until then, add-ons are expected to remain the dominant expression of PE risk appetite.
V. Secondaries: From Stopgap to Structural Liquidity
With traditional exit channels still constrained, the global secondaries market has emerged as a critical pressure valve for private equity liquidity. As shown above, secondaries transaction volume is on track to surpass $200 billion in 2025, marking one of the strongest years on record and reinforcing the market’s evolution from a cyclical workaround into a core component of the PE ecosystem.
Momentum has accelerated meaningfully over the past 18 months. After approximately $160 billion in transaction volume in 2024, activity in H1 2025 alone exceeded $100 billion, putting full-year 2025 estimates well above prior peaks. This growth has been driven by a combination of factors: aging fund vintages, elevated dry powder across secondary specialists, and continued reluctance among GPs to exit high-quality assets at discounted valuations.

Continuation vehicles have been a particularly important driver. Rather than forcing realizations into an uncertain exit market, sponsors are increasingly opting to roll top-performing assets into GP-led secondary structures, providing liquidity to existing LPs while retaining upside. The expansion of tertiary strategies (“secondaries squared”) further reflects growing institutionalization and investor confidence in the asset class.
Looking ahead to 2026, secondaries are expected to remain an essential, not optional, component of PE liquidity management. While a recovery in IPOs and strategic M&A would ease some pressure, the sheer volume of capital locked in mature funds suggests that secondary solutions will continue to scale. In this environment, the ability to structure and execute GP-led processes effectively is becoming a core competitive differentiator for private equity firms.
VI. The Opportunity Cost of Capital: Why Cash Is No Longer the Default
Recent shifts in private equity deployment cannot be understood in isolation from broader capital market conditions. As shown above, most fixed income sectors now offer yields meaningfully above cash, fundamentally reshaping the opportunity cost of capital for institutional investors. Unlike the post-GFC and pandemic-era environment—when near-zero rates pushed allocators up the risk curve—today’s market allows investors to earn mid- to high-single-digit yields across public credit, structured products, and private credit without assuming equity-level risk.
This dynamic has important implications for private equity. With U.S. cash yields near 4% and private credit approaching high-single- to low-double-digit returns, capital is no longer compelled into PE simply to generate acceptable income. As a result, allocators have greater flexibility to be patient—deploying selectively into high-conviction buyouts, add-on strategies, and continuation vehicles, while allocating incremental capital to private credit where risk-adjusted returns are more immediate and visible.

The relative attractiveness of private credit is particularly notable. New issue private credit yields now exceed most public fixed income sectors and compare favorably to historical PE return assumptions on a net, risk-adjusted basis—especially in an environment where exit timelines are extending. This yield advantage helps explain the sustained fundraising momentum in private credit and the growing role it plays alongside PE in institutional portfolios.
Importantly, this does not signal a retreat from private equity, but rather a repricing of patience. With credible alternatives to cash available, both LPs and GPs are prioritizing structure, sequencing, and downside protection over speed of deployment. In this context, the current PE slowdown reflects rational capital allocation in a yield-rich environment—not diminished confidence in the asset class’s long-term return potential.
VII. Portfolio Construction: Rethinking Risk, Size, and Sequencing

As private markets continue to mature, private equity is increasingly being evaluated not in isolation, but as part of a broader portfolio ecosystem that includes private credit and infrastructure. The analysis above highlights a key shift in how institutional investors are approaching capital allocation: outcomes are being driven as much by sizing and sequencing as by asset selection.
The data suggests that different private asset classes respond very differently to incremental diversification. In private credit portfolios, increasing the number of positions delivers a meaningful improvement in median portfolio outcomes, driven by the ability to diversify away default risk across a larger loan base. By contrast, incremental diversification in private equity and infrastructure shows diminishing marginal benefits beyond a certain deal count, reflecting the more idiosyncratic and return-skewed nature of those strategies.
This distinction has important implications for portfolio design. Concentration in fewer, higher-conviction buyouts or infrastructure assets can enhance returns where upside is asymmetric, while broader diversification is more effective in credit-heavy allocations where return distributions are tighter. In practice, this is leading allocators to pursue hybrid portfolio architectures—combining concentrated PE exposure with more granular credit allocations to balance volatility, income stability, and capital preservation.
In the context of FY2025–2026, this approach aligns well with prevailing market conditions. With exit timelines extending, fundraising slowing, and liquidity increasingly managed through secondaries, investors are placing greater emphasis on whole-portfolio resilience rather than maximizing exposure to any single strategy. As a result, portfolio optimization—rather than outright risk-taking—is emerging as a defining theme of the next phase of private markets investing.
VII. Conclusion: A Market Reset, Not a Retreat
Private equity in FY2025 is best understood not as a market in decline, but as one in strategic recalibration. Capital deployment remains resilient, yet increasingly concentrated; deal volumes are subdued, but conviction-led transactions—particularly megadeals, add-ons, and GP-led secondaries—continue to define activity. Across regions and sectors, the common thread is selectivity: investors are deploying capital where scale, durability, and operational leverage justify risk, while deferring broader participation until valuation alignment and exit visibility improve.
The dominance of add-on transactions and the sustained suppression of platform buyouts underscore a broader repricing of risk. Rather than launching new platforms at uncertain entry points, sponsors are leaning into incremental value creation—deepening existing portfolios, enhancing margins, and preparing assets for eventual exits. At the same time, the rapid expansion of the secondaries market highlights the extent to which liquidity management has become a structural necessity, not a temporary workaround, in an environment where capital remains locked longer than historical norms.
For allocators, these dynamics are reshaping portfolio construction decisions. The growing distinction between return profiles in private equity, private credit, and infrastructure is pushing investors toward more deliberate sizing, sequencing, and diversification strategies. In this context, portfolio optimization—balancing concentration where upside is asymmetric and diversification where risk is linear—is emerging as a defining discipline of private markets investing.
Looking into 2026, the trajectory of private equity will depend less on the availability of capital and more on the normalization of exits, the pace of IPO reopenings, and confidence in earnings durability amid evolving macro and geopolitical conditions. While a gradual recovery appears underway, the next phase of the cycle is likely to reward precision over pace, structure over scale, and strategic flexibility over broad risk-taking. For both GPs and LPs, success will hinge on navigating this transition with discipline—deploying capital selectively, managing liquidity creatively, and aligning portfolios with a market that is evolving, not retreating.
Sources and References:
BlackRock — Private Markets Outlook 2026: A New Continuum
J.P. Morgan — Outlook 2026: Promise and Pressure
KPMG — Pulse of Private Equity Q3’25: A Quarterly Analysis of Global PE Activity
McKinsey & Company — Global Private Markets Report 2025: Braced for Shifting Weather
Premium Perks
Since you are an Executive Subscriber, you get access to all the full length reports our research team makes every week. Interested in learning all the hard data behind the article? If so, this report is just for you.
|
