- PE 150
- Posts
- Private Debt Indexes vs. Real Estate: A Decade of Comparative Performance
Private Debt Indexes vs. Real Estate: A Decade of Comparative Performance
In recent years, investors have increasingly turned toward private debt as an alternative to traditional fixed-income strategies.

As interest rates fluctuated and public markets experienced volatility, private credit strategies—particularly Direct Lending and Alternative Credit—have sought to offer attractive risk-adjusted returns. At the same time, Real Estate has long been considered a dependable private market allocation, although it faced headwinds during the post-pandemic interest rate environment.
The two charts below illustrate how these asset classes have performed over time and how cumulative returns compare from 2015 through 2025 year-to-date.
Long-Term Performance Trends
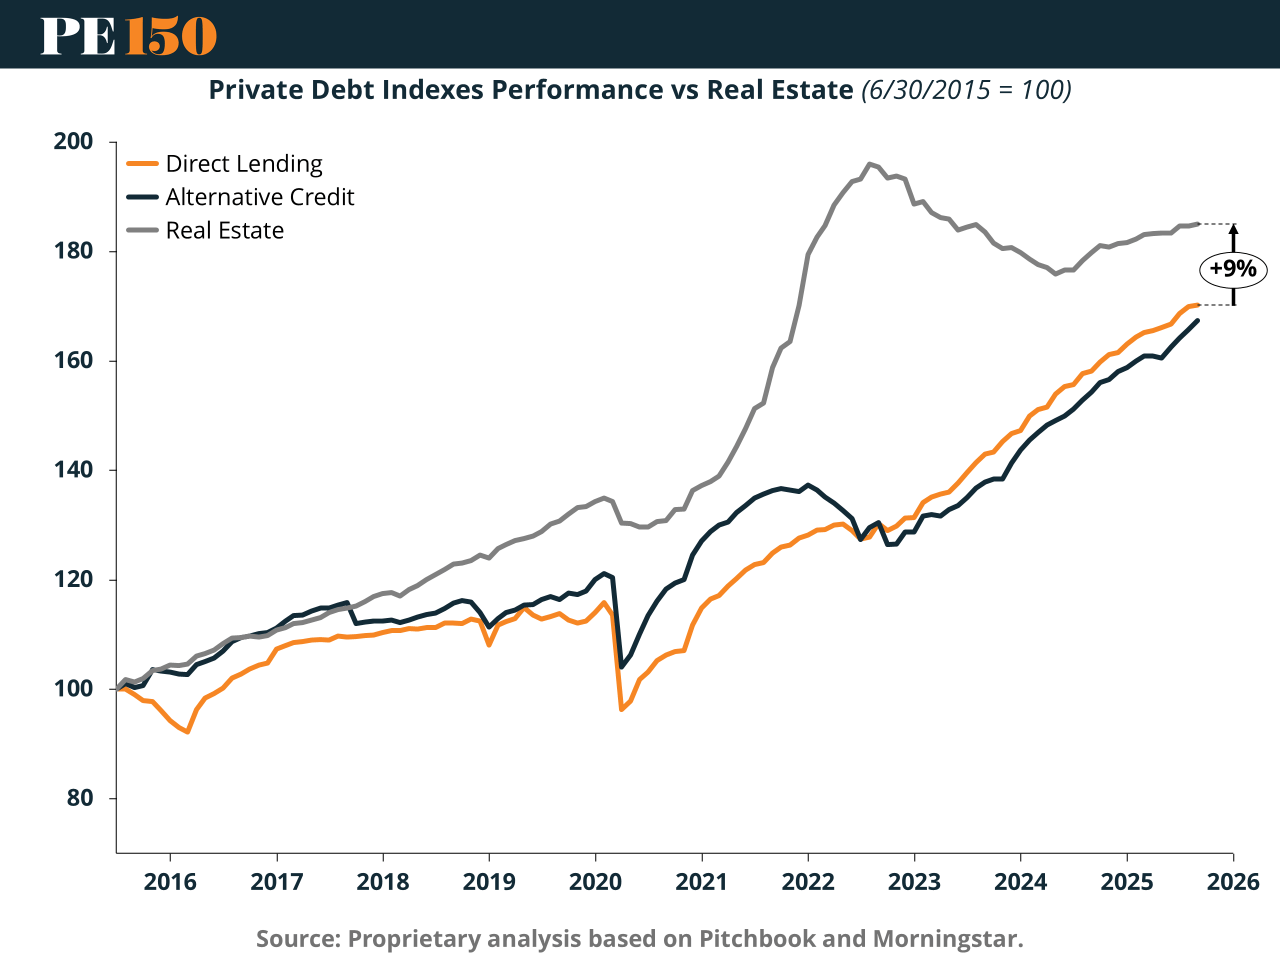
The first chart tracks index performance from 2015 to 2025, benchmarked to 100 in mid-2015. Several key trends emerge:
Real Estate Outperforms Over the Long Horizon
Real Estate shows a strong upward trajectory, significantly outpacing both Direct Lending and Alternative Credit beginning in 2017. Although values softened during the economic adjustments of 2020 during the COVID-19 pandemic.
Private Debt Demonstrates Stability and Resilience
Direct Lending and Alternative Credit performance lines largely move in tandem, exhibiting:
More consistent return patterns than Real Estate
Smaller drawdowns during periods of market stress (notably the early 2020 pandemic disruption)
Accelerating growth from 2021 onward
By 2025, the spread between Alternative Credit and Direct Lending narrows, with Direct Lending slightly ahead by approximately 9%.
Interpreting Market Dynamics
The upward trend in private credit aligns with:
Increased demand for non-bank financing
Elevated yields driven by higher base rates
Institutional portfolio reallocation into private debt for predictable cash flow
Cumulative Returns: 2015–2025 YTD

The second chart compares cumulative returns across asset categories since 2015. It highlights that:
Cumulative Returns (2015–2025 YTD)
Real Estate: 85.04%
Direct Lending: 70.16%
Private Debt Average: 68.76%
Alternative Credit: 67.36%
Performance gap Real Estate vs. Private Debt Average: +24%
Real Estate Leads by a Wide Margin
Real Estate delivered an 85% cumulative return, outperforming the private debt average by approximately 24%. Despite volatility linked to rate movements and valuation pressure, long-term capital appreciation provided meaningful advantages.
Private Debt Remains Competitive
While lagging Real Estate over this period, private debt strategies still posted mid-to-high-60% cumulative gains, offering:
Lower price volatility
Strong income-oriented yield components
Reduced sensitivity to public market cycles
Key Takeaways for Investors
Portfolio Diversification Advantage
Real Estate and private debt complement each other well. Real Estate provides long-term appreciation and inflation protection, while private debt offers income stability and lower downside risk.
Interest Rate Environment Matters
As rates stabilize or decline, Real Estate may continue recovering from recent valuation adjustments, while private debt yields may normalize.
Growing Institutional Allocation to Private Credit
Demand for Direct Lending and Alternative Credit is expected to increase, particularly among pension funds and endowments seeking dependable returns not correlated with equity volatility.
Conclusion
Over the last decade, Real Estate has been the top performer, but private debt has proven itself as a resilient and attractive component of diversified portfolios. In an era of shifting economic conditions and evolving capital markets, investors benefit from examining how these asset classes interact across cycles rather than relying solely on headline returns.