- PE 150
- Posts
- Volatility Destroys Wealth
Volatility Destroys Wealth
The U.S. economy has entered an era of sustained uncertainty, marked by post-pandemic structural shifts, persistent inflation, aggressive monetary tightening, and renewed fiscal risks.

1. A Decade Shaped by Instability
The U.S. economy has entered an era of sustained uncertainty, marked by post-pandemic structural shifts, persistent inflation, aggressive monetary tightening, and renewed fiscal risks. The sharp GDP contraction in early 2020, followed by an unprecedented rebound, highlights the instability that continues to influence both investor expectations and policy decisions. Although growth has returned to positive levels, its path remains uneven and below historical norms.
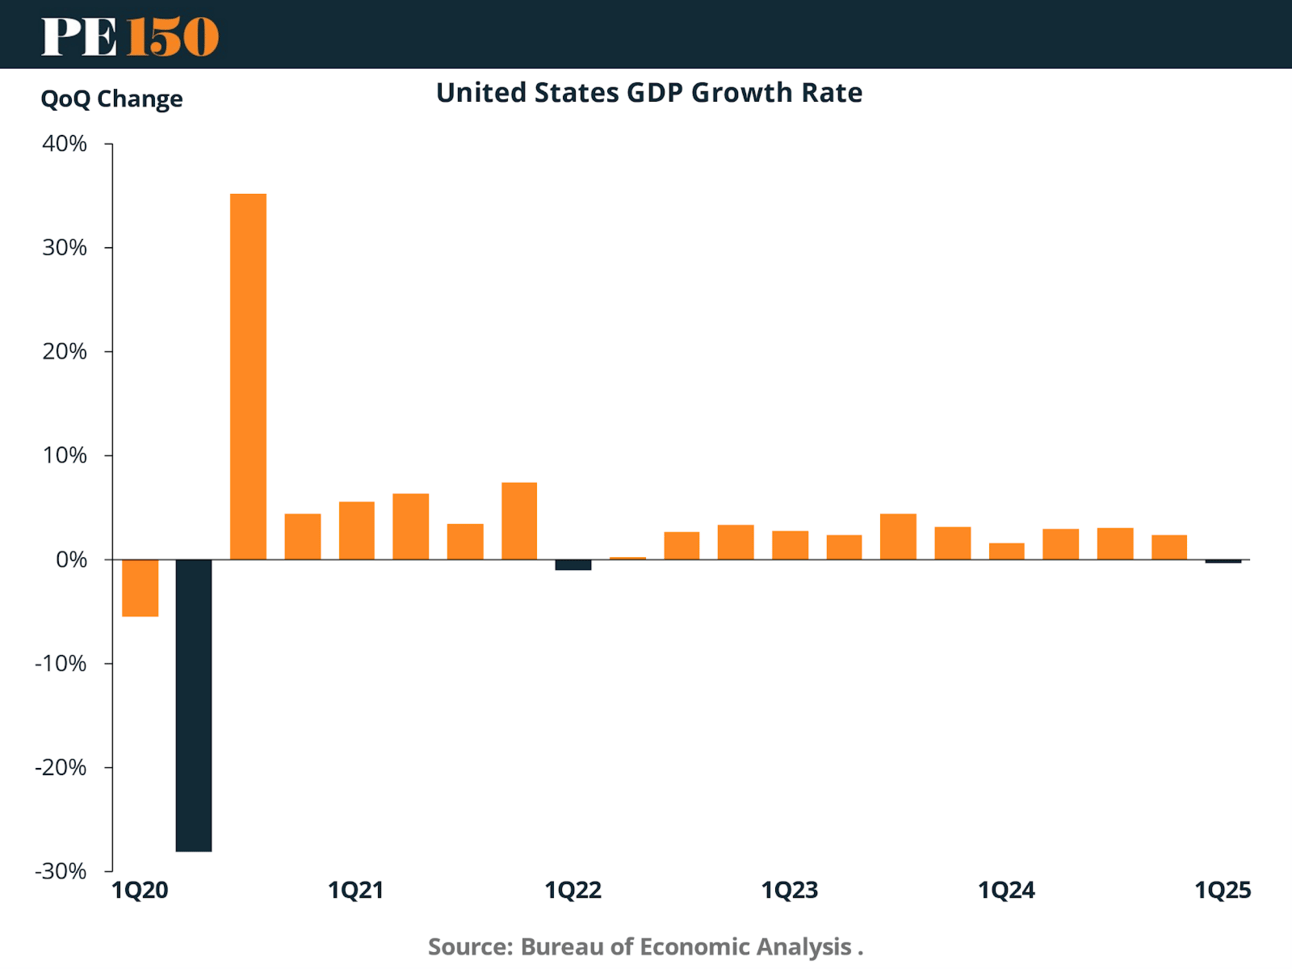
This chart depicts the sharp GDP contraction and subsequent rebound around 2020, followed by a return to modest and volatile growth.
Since Q1 2021, GDP growth has struggled to establish a consistent trajectory. Although some quarters showed strength, the broader trend reflects weakening momentum amid tighter financial conditions, diminishing fiscal stimulus, and global macroeconomic challenges. Recent quarters have shown stagnating growth—hovering around zero in early 2025—raising concerns about a potential soft landing or a shallow recession.
2. Inflation Pressures and Monetary Policy Response
Stimulus measures during the pandemic and global supply chain disruptions triggered one of the sharpest inflationary surges in decades. U.S. Consumer Price Index inflation peaked near 9% YoY in mid-2022, prompting an aggressive policy response by the Federal Reserve. Although headline inflation has since moderated, core inflation (excluding food and energy) remains elevated and sticky—persistently above the Fed’s 2% target.
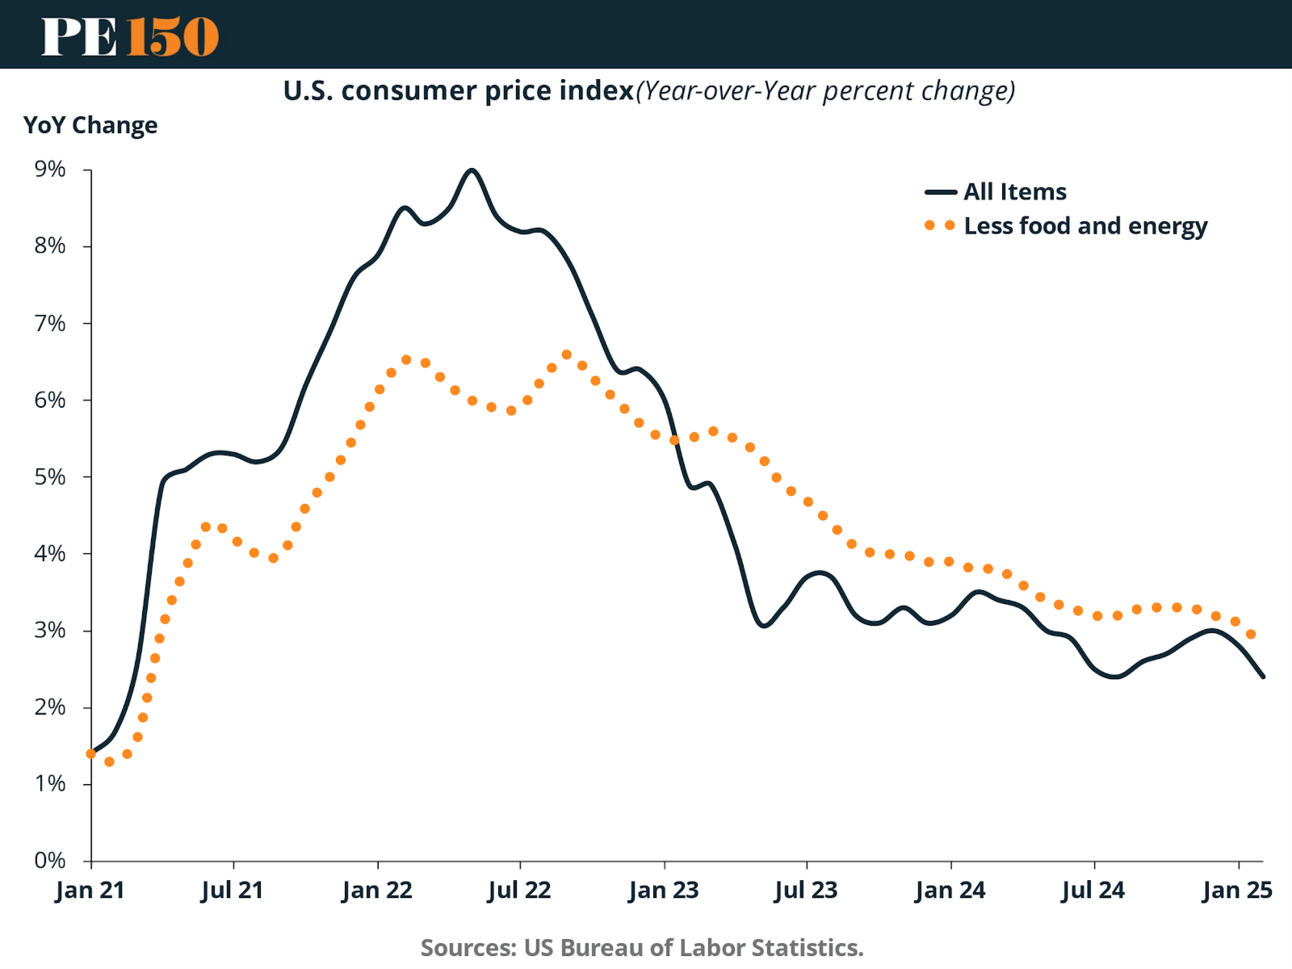
This chart compares headline and core inflation trends, emphasizing the persistence of price pressures despite declining energy costs.
3. Interest Rates and Policy Volatility
In response to inflation, the Federal Reserve executed the fastest rate-hiking cycle in over 40 years, raising the Federal Funds Rate from near zero to over 5% in less than two years. While market yields on 10-year Treasury securities have risen as well, they remain below historical peaks, reflecting skepticism among investors about the sustainability of long-term growth and inflation.
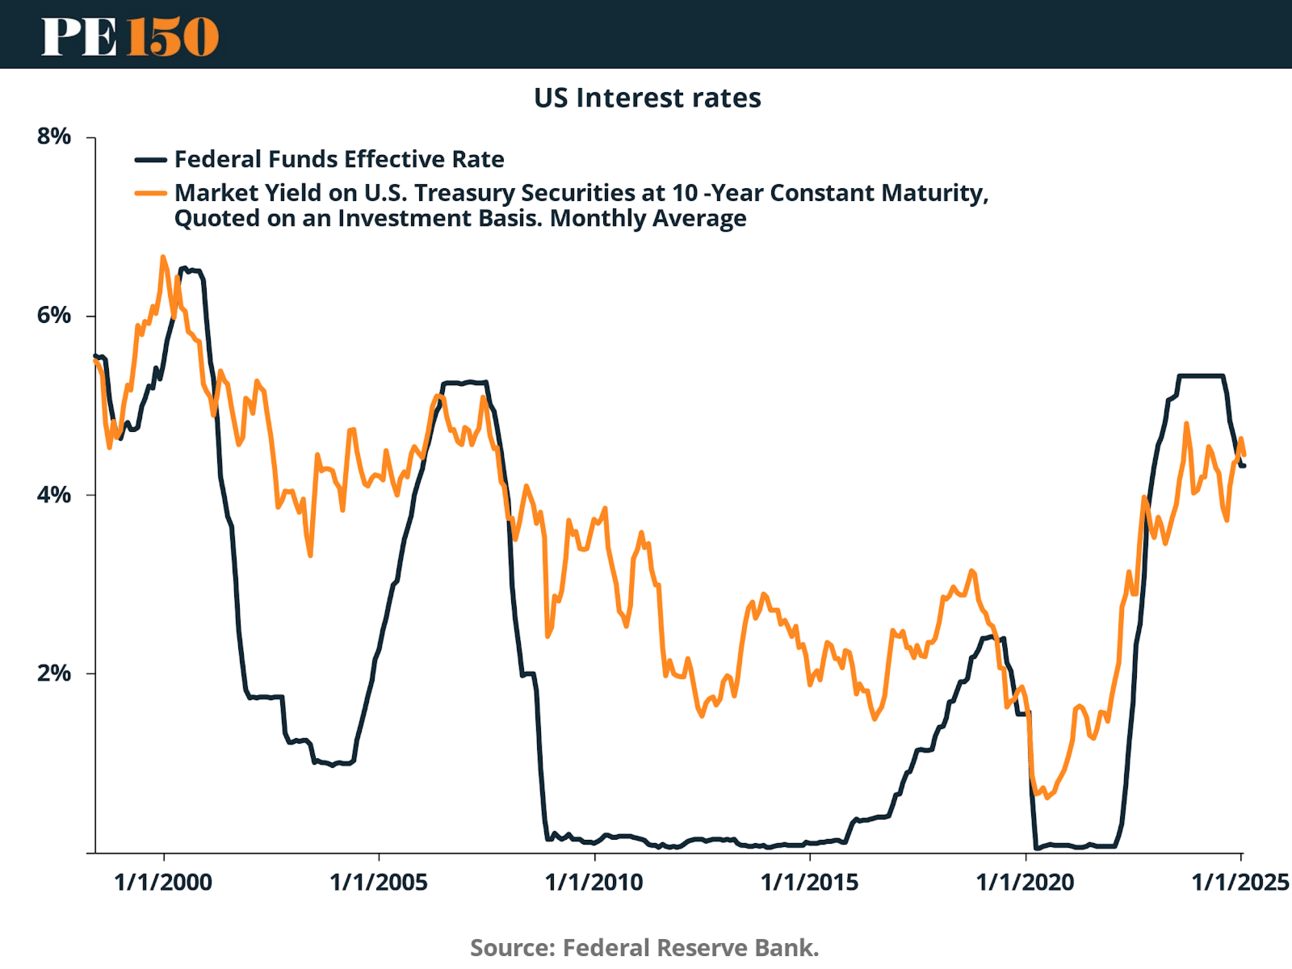
This chart highlights the sharp divergence between short- and long-term rates, signaling policy-induced distortions and yield curve inversion risk.
The yield curve inversion—a typical recession indicator—has persisted, fueling concerns about the economic outlook. Elevated interest rate volatility has also spilled into equity and credit markets, increasing risk premiums and diminishing investor appetite for long-duration assets.
How Does Volatility Manifest in Public Markets? A Case Study: Sudden Stops
One of the clearest demonstrations of how public markets react to elevated uncertainty is the sudden stop phenomenon seen in emerging market capital flows. In response to macroeconomic or geopolitical shocks, capital rapidly exits liquid, publicly traded assets—often indiscriminately—regardless of underlying fundamentals.
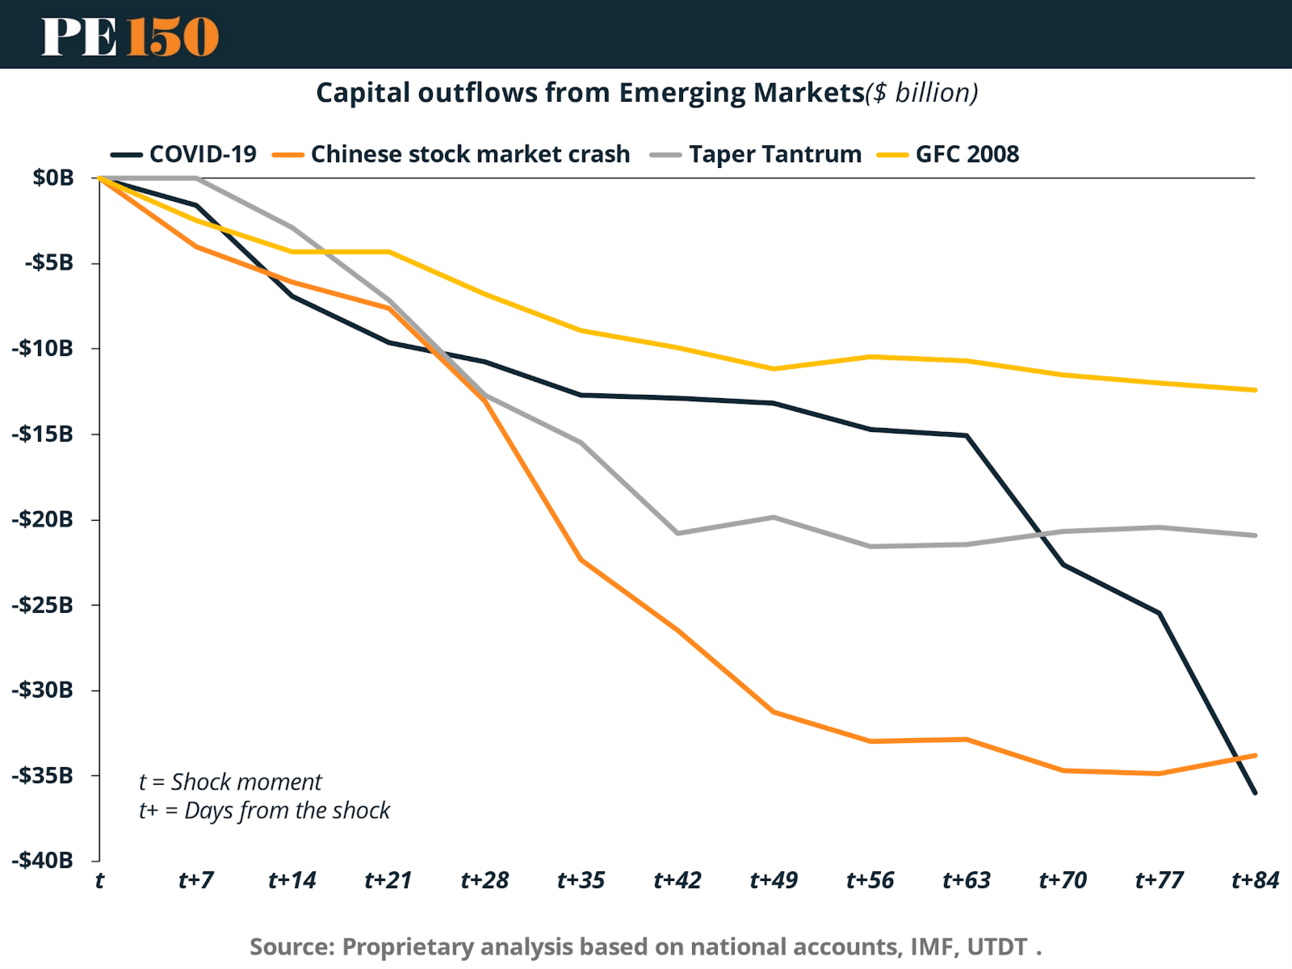
This chart compares four major volatility events: the Global Financial Crisis (2008), the Taper Tantrum (2013), the Chinese Stock Market Crash (2015), and the COVID-19 shock (2020). In each case, capital outflows from emerging markets surged within days, with cumulative losses frequently surpassing $30–$35 billion within three months.
The most severe outflows occurred during the COVID-19 crisis, underscoring how a global health emergency, compounded by economic paralysis and policy uncertainty, can overwhelm investor risk models and trigger systemic de-risking. Importantly, these outflows were concentrated in public instruments—sovereign debt, equities, and ETFs—whereas private capital flows remained relatively stable due to longer lock-up periods and lower sensitivity to mark-to-market valuations.
These episodes demonstrate that while liquidity and transparency are advantages in normal markets, they can become liabilities during times of stress. Public markets absorb shocks quickly, but often at the cost of significant short-term wealth destruction. Capital exits rapidly, volatility spikes, and asset correlations increase—amplifying the impact of uncertainty.
In contrast, private markets are structurally insulated from such reversals, offering a form of passive stability. Investors with longer investment horizons and committed capital structures are better positioned to weather volatility, rather than being forced to sell during market drawdowns.
Comparing Public vs. Private Markets: Volatility, Sensitivity, and Wealth Preservation
1. How Public and Private Markets React to Interest Rates
The transmission of interest rate changes into market valuations is a key driver of financial volatility. This section compares how public equity indices and U.S. private equity middle-market deal values respond to long-term interest rates, using ordinary least squares (OLS) regressions on log-transformed data for both variables. Specifically, we examine how the log of the 10-year U.S. Treasury yield influences the log of NASDAQ Composite returns and the log of PE middle-market deal values.
Public Markets: High Sensitivity and Negative Elasticity
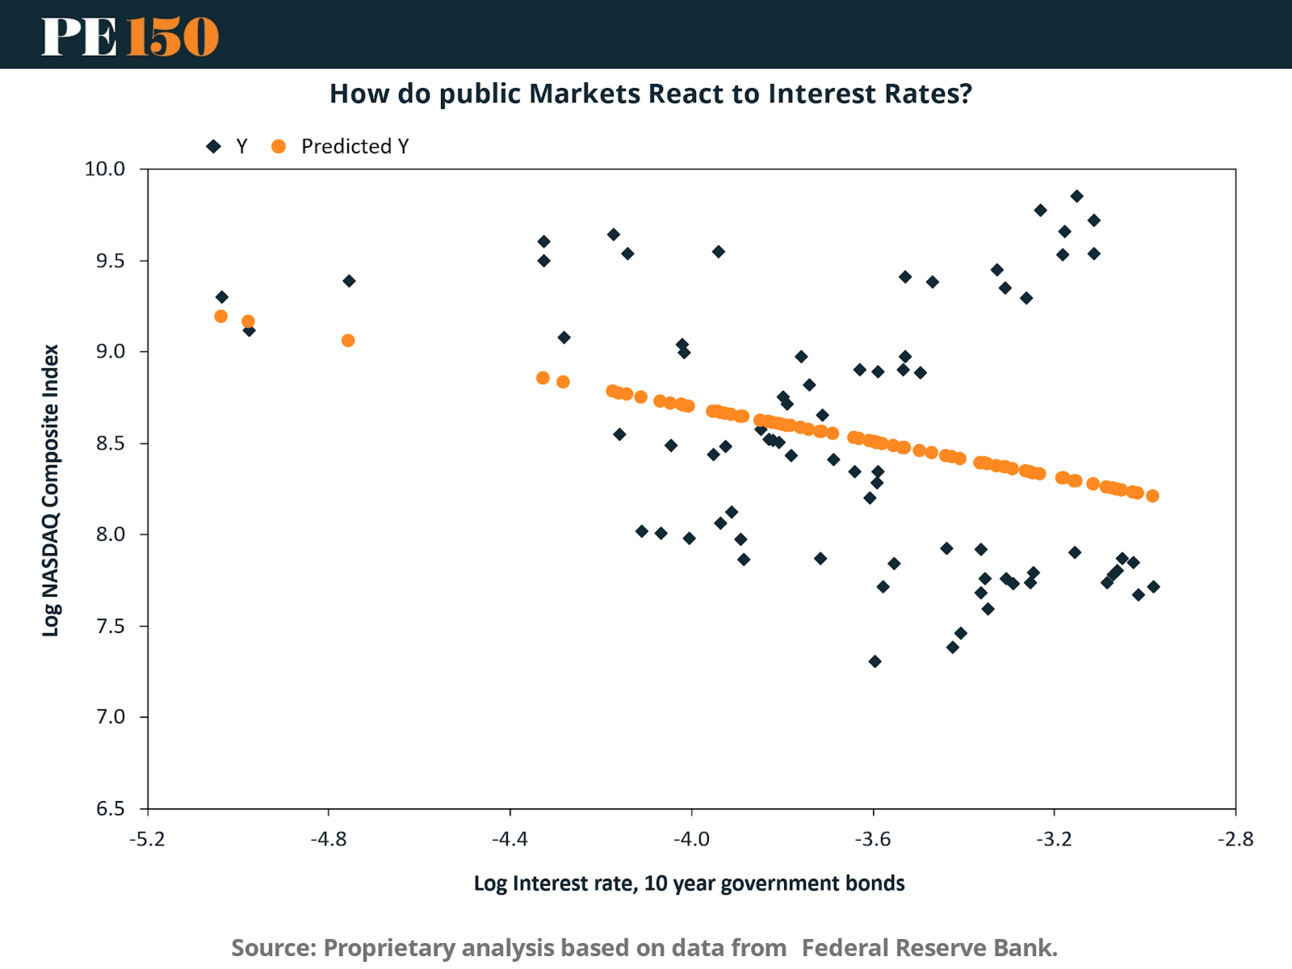
The scatterplot above shows a clear negative relationship between long-term interest rates and the NASDAQ Composite Index. As yields rise, valuations fall—reflecting higher discount rates on future cash flows, increased equity risk premia, and reduced investor appetite for growth.
The OLS regression coefficient for the NASDAQ Composite Index is −0.4785, while the NASDAQ 100 shows even greater sensitivity at −0.5706. These elasticities imply that a 1% increase in long-term rates (log terms) is associated with a roughly 0.5% decline in the index—demonstrating strong market sensitivity.
Private Markets: Milder Response, Structural Insulation
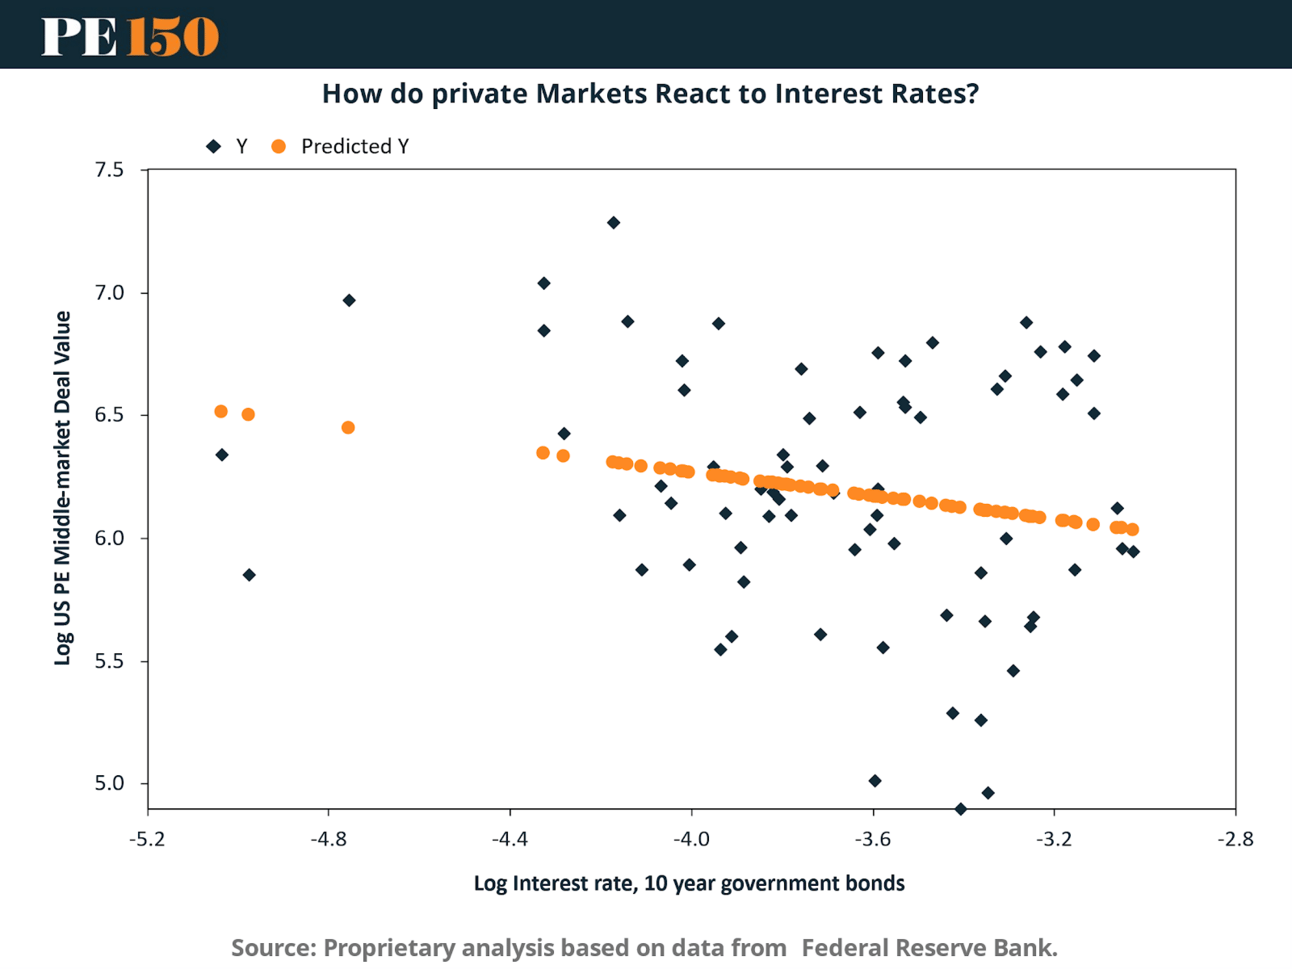
In contrast, private equity valuations—measured here through middle-market deal value—display a much weaker relationship with interest rates. The predicted values slope only slightly downward, indicating that while monetary conditions do matter, their impact is muted relative to public equities.
The OLS coefficient for private equity is −0.2307, less than half the sensitivity seen in the NASDAQ 100. This muted relationship is consistent with the structural features of private equity: long investment horizons, illiquidity, negotiated valuations, and an emphasis on operational value creation over market timing.
Visual Summary: Public vs. Private Sensitivity
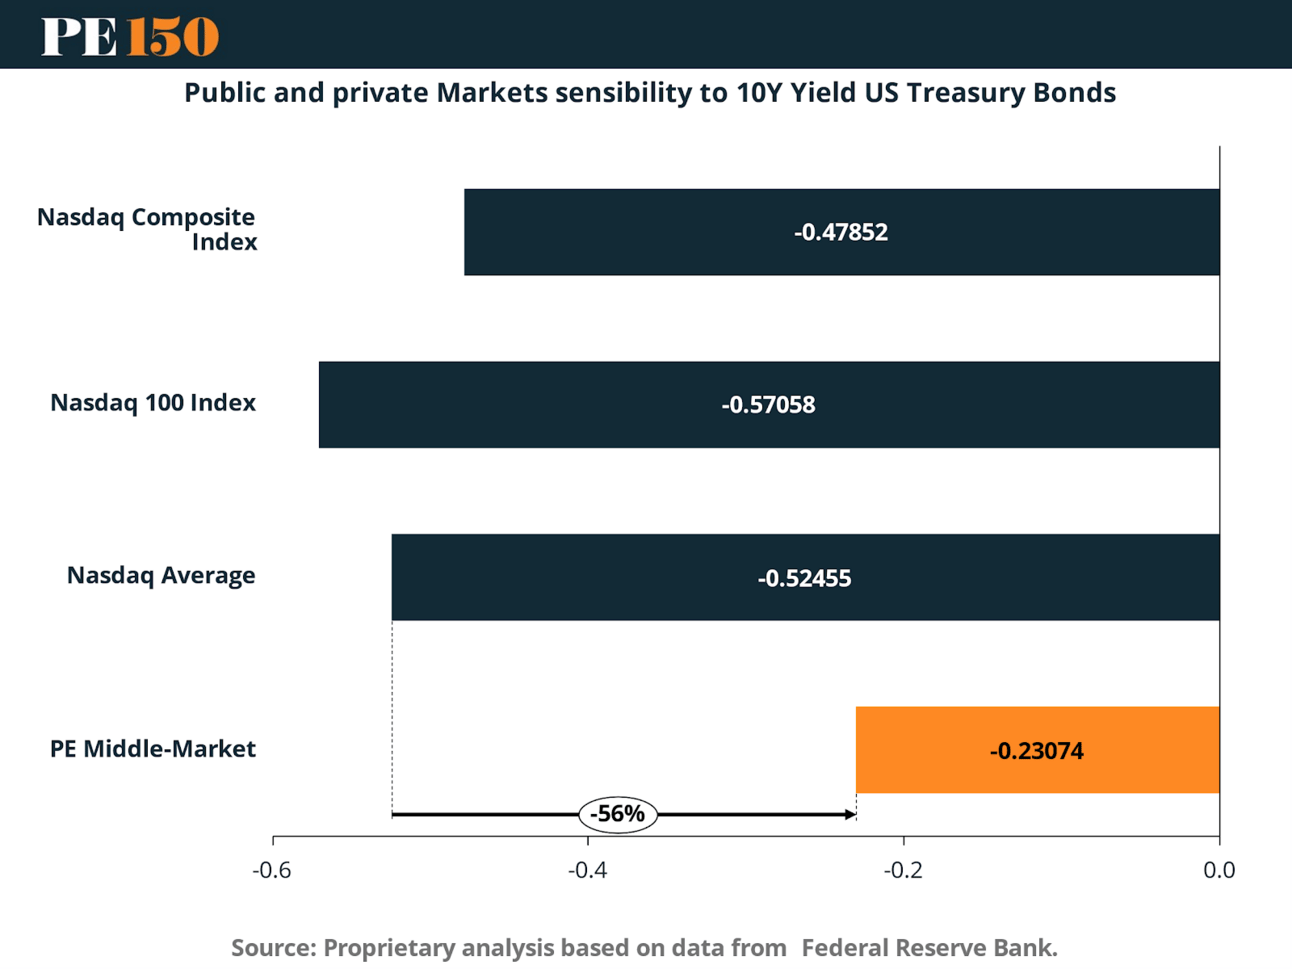
This bar chart summarizes the regression results, showing that the average NASDAQ sensitivity (−0.5245) is more than twice that of PE Middle-Market (−0.2307). Public market valuations are thus more exposed to interest rate volatility and macro sentiment, whereas private markets demonstrate greater resilience and valuation stability.
2. How Public and Private Markets React to Economic Uncertainty
Periods of elevated economic uncertainty consistently lead to increased volatility in financial markets, particularly public equities. This section explores how uncertainty shocks propagate across asset classes by comparing their annualized volatility responses to fluctuations in the Equity Market-related Economic Uncertainty Index.
Uncertainty Cycles and Systemic Impact
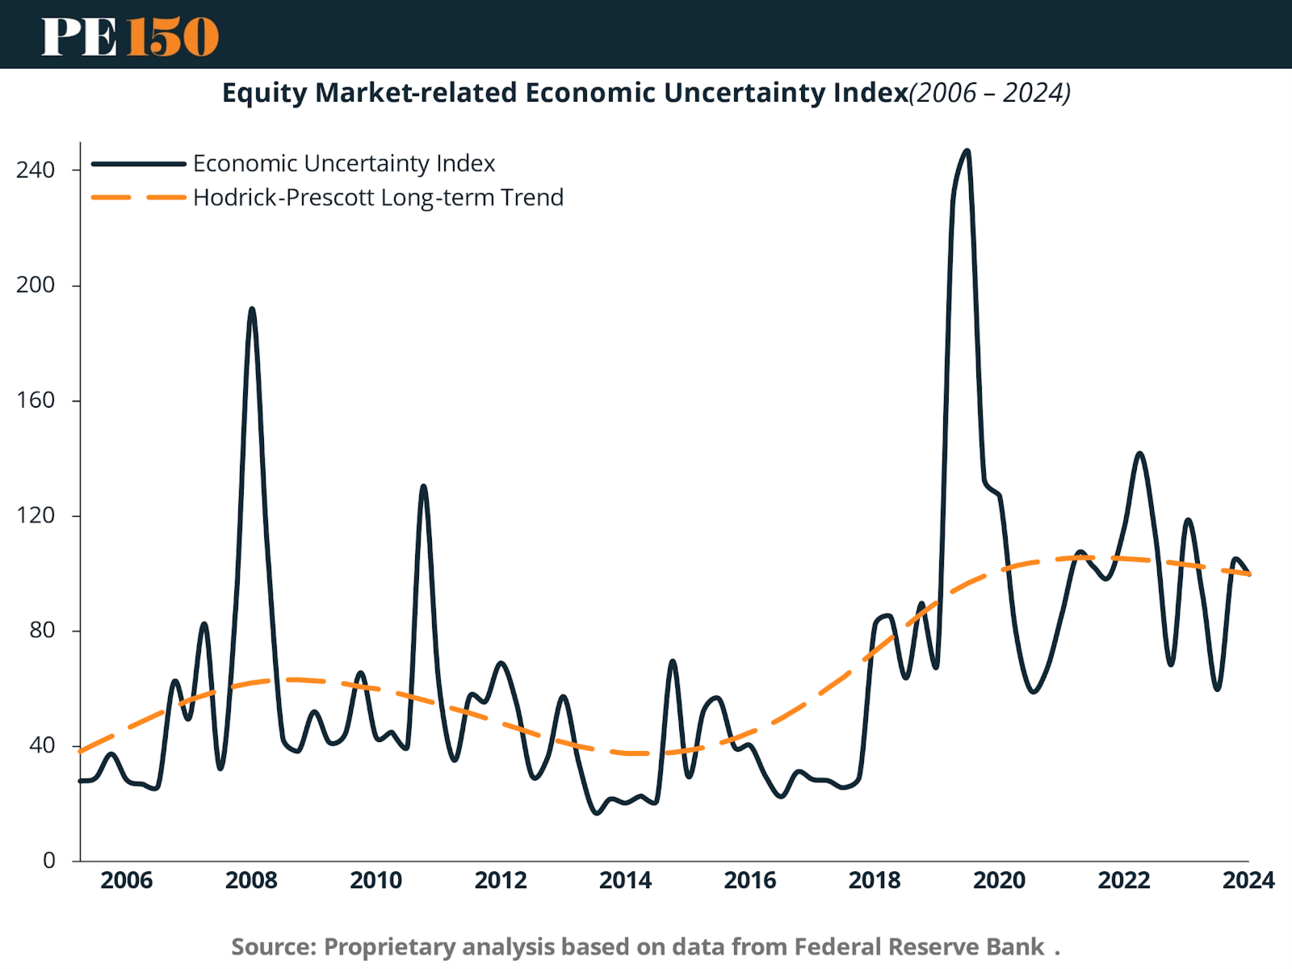
This chart illustrates the cyclical behavior of macro uncertainty from 2006 through 2024. Spikes align with major macroeconomic shocks, including the 2008 financial crisis, the 2011 debt ceiling standoff, the 2018 trade war, and the 2020 COVID-19 pandemic.
Each upward spike reflects not just higher volatility, but also greater forecast uncertainty, increased investor caution, and sharper shifts in capital allocation—especially within liquid instruments.
Volatility Response Across Market Types
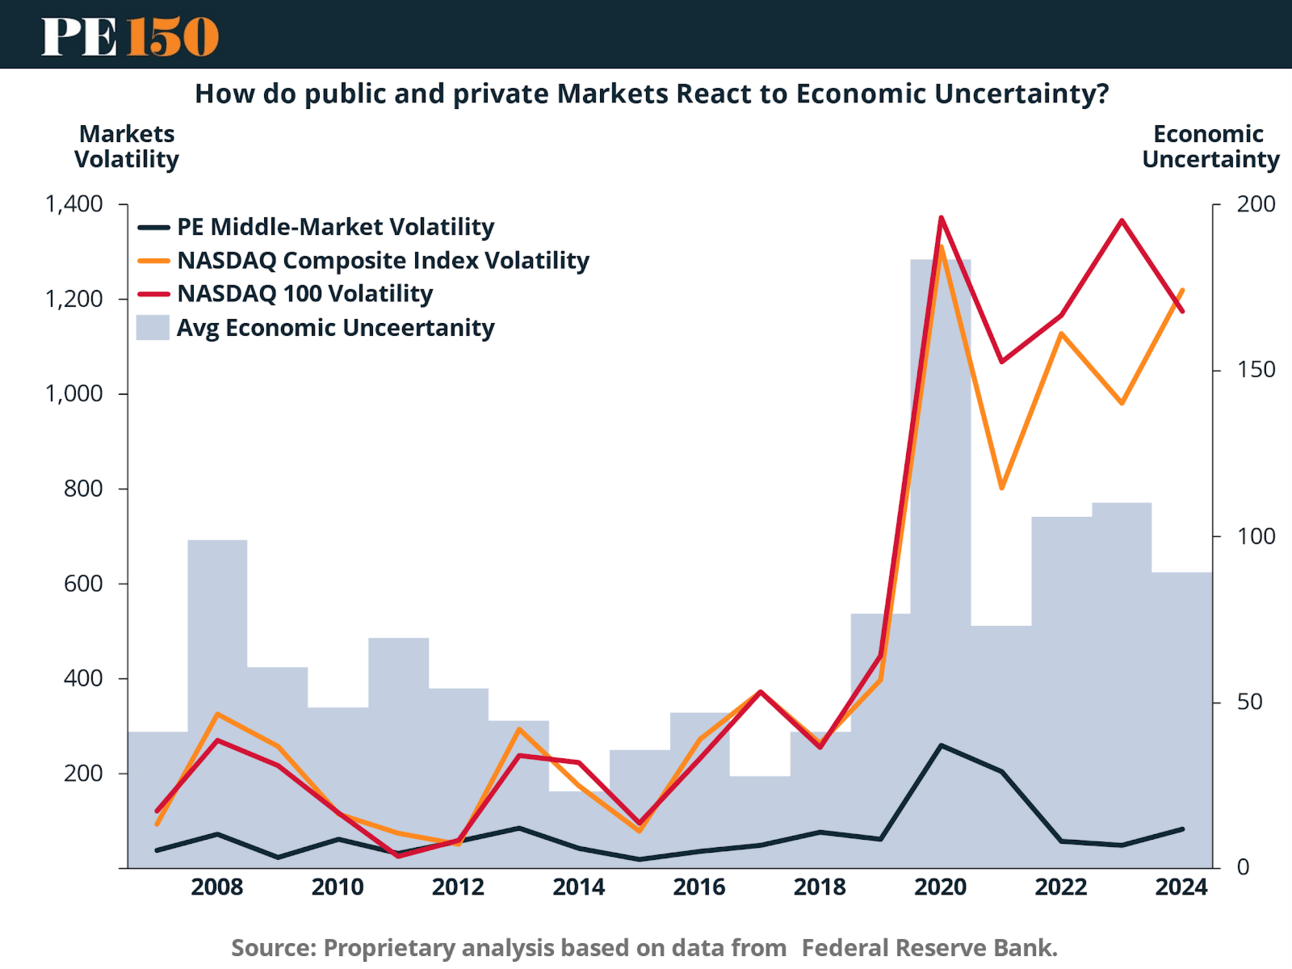
This chart plots annualized standard deviations for NASDAQ Composite, NASDAQ 100, and U.S. PE Middle-Market assets against the average uncertainty level for each year. It highlights a pronounced asymmetry in market reactions.
Public markets (NASDAQ Composite and NASDAQ 100) show a direct and immediate increase in volatility during uncertainty spikes. In 2020, NASDAQ volatility surged beyond 1,200 points—mirroring the rise in macro uncertainty.
By contrast, PE Middle-Market volatility remained significantly lower—even during peak uncertainty periods. The uptick in 2020 was mild and temporary.
This divergence highlights the structural resilience of private markets. The absence of daily repricing, the illiquidity premium, and commitment-based capital structures help dampen the feedback loop between macro news and valuation behavior.
Implications for Portfolio Construction
Strategically, these findings reinforce the value of private market exposure during unstable macroeconomic periods. Public markets, while liquid and responsive, tend to amplify short-term shocks through sentiment-driven trading and algorithmic price discovery. Private equity, by contrast, acts as a volatility buffer, enabling investors to remain invested through the cycle without being forced to react to transitory macro headlines.
3. Public Equity Markets: Volatility Amplification and Sensitivity to Macro Drivers
To better understand how macro volatility translates into asset-level risk, we analyze sensitivity coefficients (π, φ) and corresponding volatility amplification ratios (δ/δ) for public equity indices and U.S. PE Middle-Market assets. The table below summarizes OLS regressions using log-transformed market values and key macro drivers: 10-year U.S. Treasury yields, Federal Funds Effective Rate, and the Economic Uncertainty Index.
Public Markets: High Sensitivity and Amplification
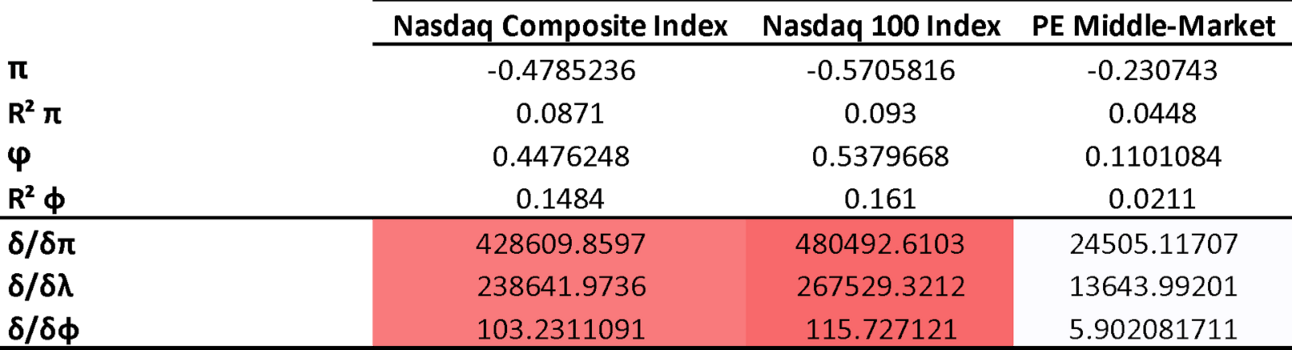
The regression coefficients for NASDAQ Composite and NASDAQ 100 confirm that public equities are highly sensitive to macro volatility:
π (interest rate sensitivity) is −0.4785 for NASDAQ Composite and −0.57058 for NASDAQ 100—statistically significant and reflecting strong negative relationships.
φ (economic uncertainty sensitivity) is 0.4476 – 0.5379 —indicating that uncertainty shocks strongly correlate with public market volatility.
Volatility amplification ratios are particularly revealing:
δ/δπ exceeds 428,000 for NASDAQ Composite—showing that even modest rate volatility triggers outsized equity swings.
δ/δφ exceeds 100—confirming that public markets not only react to uncertainty, but often overreact.
Private Markets: Lower Sensitivity and Statistical Insulation
U.S. PE Middle-Market assets display much lower sensitivity:
π is −0.2307, indicating moderate sensitivity to interest rates.
φ is just 0.1101 and statistically insignificant (pv > 0.05) —meaning that private equity valuations are not materially affected by uncertainty at a mathematical significant level.
Volatility amplification ratios are similarly muted:
δ/δπ is just 24,505—roughly 18 times lower than public equities.
δ/δφ is only 5.902—compared to more than 100 in public markets.
These findings emphasize that private equity valuations exhibit far less sensitivity to macroeconomic volatility—particularly uncertainty shocks.
Conclusion: Why PE Remains the Smarter Play
Public markets offer liquidity—but too often at the cost of stability. The past two decades of "sudden stops," yield curve whipsaws, and violent equity swings have shown how volatility systematically erodes wealth. In contrast, private equity—despite grappling with its own liquidity challenges—remains structurally better suited for wealth preservation during uncertain times.
The reasons are clear. PE capital is patient by design, shielded from daily mark-to-market volatility and sentiment-driven selling. Continuation funds, NAV-based facilities, and secondaries provide GPs with increasing flexibility to manage liquidity needs without forced exits. While public markets reward speed, PE rewards discipline and underwriting rigor—a significant advantage in today’s fractured macro landscape.
Consider this: private markets control $5.3T AUM, with just $112B in secondaries volume—an intentional illiquidity premium that favors long-term value compounding. When public markets seize up, PE managers can selectively deploy capital into distressed or mispriced assets without being forced to play defense.
In short: PE may not be immune to macro headwinds, but its structural advantages—control over timing, capital deployment, and exit paths—make it a smarter, safer option for preserving and growing capital through volatile cycles.
Sources & References
Baker, Scott R., Bloom, Nick and Davis, Stephen J., Equity Market-related Economic Uncertainty Index [WLEMUINDXD], retrieved from FRED, Federal Reserve Bank of St. Louis; https://fred.stlouisfed.org/series/WLEMUINDXD, June 4, 2025.
Board of Governors of the Federal Reserve System (US), Federal Funds Effective Rate [DFF], retrieved from FRED, Federal Reserve Bank of St. Louis; https://fred.stlouisfed.org/series/DFF, June 4, 2025.
Board of Governors of the Federal Reserve System (US), Market Yield on U.S. Treasury Securities at 10-Year Constant Maturity, Quoted on an Investment Basis [DGS10], retrieved from FRED, Federal Reserve Bank of St. Louis; https://fred.stlouisfed.org/series/DGS10, June 4, 2025.
NASDAQ OMX Group, NASDAQ 100 Index [NASDAQ100], retrieved from FRED, Federal Reserve Bank of St. Louis; https://fred.stlouisfed.org/series/NASDAQ100 June 4, 2025.
NASDAQ OMX Group, NASDAQ Composite Index [NASDAQCOM], retrieved from FRED, Federal Reserve Bank of St. Louis; https://fred.stlouisfed.org/series/NASDAQCOM, June 4, 2025.
PE150. (2025). Moody’s Downgrades U.S. Credit Rating Over Fiscal Risk and Inflation. https://www.pe150.com/p/moody-s-downgrades-u-s-credit-rating-amid-rising-fiscal-concerns-1830
PE150. (2025). The State of Private Equity Middle-Market in US. https://www.pe150.com/p/the-state-of-private-equity-middle-market-in-us
Pitchbook. (2024). US PE Middle Market Report. https://files.pitchbook.com/website/files/pdf/2024_Annual_US_PE_Middle_Market_Report.pdf
Premium Perks
Since you are an Executive Subscriber, you get access to all the full length reports our research team makes every week. Interested in learning all the hard data behind the article? If so, this report is just for you.
|
