- PE 150
- Posts
- Illiquidity’s Advantage
Illiquidity’s Advantage
Safeguarding Wealth in Uncertain Markets: Managing Volatility, Flexibility, and the Long-Run Edge of Private Assets

I. Introduction: Why Illiquidity Matters
For many investors, liquidity feels reassuring. The freedom to buy and sell at will conveys control—an apparent pillar of prudent portfolio design. Yet, used in excess, liquidity can erode value when combined with volatility, uncertainty, and reactive decision-making. This report advances a bold, data-backed view: illiquidity is not a hazard to shun but a premium to pursue.
Liquidity suggests optionality, but in market stress it often turns into a liability. Public assets—equities, bonds, and ETFs—are repriced continuously, driven not only by fundamentals but also by sentiment, headlines, and herd effects. Illiquid assets—private equity, venture capital, and real estate—operate on a slower cadence. By design they are buffered from day-to-day swings, enabling value creation over years rather than quarters.
This report examines how public and private markets behave under macroeconomic strain. We analyze each market’s sensitivity to interest rates and uncertainty, assess how volatility shapes long-term wealth compounding, and make the case for strategic, long-horizon allocations to illiquid assets.
II. Macroeconomic Environment and Fiscal Outlook
1. A Decade Defined by Instability
The post-pandemic era has been dominated by macroeconomic disruption. After the steep GDP contraction in early 2020 and the record rebound that followed, growth has turned erratic and uneven. As fiscal and monetary support receded, inflationary pressures, reworked supply chains, and shifting geopolitics reshaped the backdrop.
From 1Q21 through early 2025, the data show fits and starts—periodic spurts of recovery against an overall pattern of stagnation. Recent quarters have seen GDP hovering just above zero, stoking concerns about a hard landing or an extended period of sluggishness.

2. Inflation Pressures and Monetary Policy Response
Pandemic-era stimulus and global supply bottlenecks produced the sharpest inflation spike in roughly forty years. Headline CPI reached about 9% year over year in mid-2022, while core inflation proved far stickier. In turn, the Federal Reserve launched its fastest tightening cycle in recent memory. M2 reached all-time high in the US, being a strong driver of inflationary upsides and pressures on the FED to raise the interest rate, consequently impacting on assets valuation, where the most impacted ones are the most liquid.

Although lower energy prices have offered some relief, core inflation remains above target. This has created a policy bind—rates must stay elevated even as growth cools. In this setting, market volatility is no longer an exception but the baseline.

3. Interest Rates and Policy Volatility
The prolonged yield-curve inversion—long a reliable recession signal—reflects fading confidence in long-term growth. The negative gap between short- and long-dated yields points to policy misalignment and uncertainty about the path ahead.
Rate volatility has spilled directly into asset prices. Public equities and long-duration bonds have posted drawdowns, credit spreads remain elevated, and investors have moved defensively—into cash, gold, and alternatives—as faith in market stability erodes.

III. How Does Volatility Look in Public Markets?
Sudden Stops and the Liquidity Trap
One of the clearest signs of liquidity’s hidden risk is the “sudden stop,” especially pronounced in emerging markets and global ETFs. When uncertainty rises, capital can flee liquid vehicles abruptly, triggering rapid exits from these assets.

Episodes such as the 2008 Global Financial Crisis, the 2013 Taper Tantrum, the 2015 China selloff, and the 2020 COVID shock saw billions exit public markets within days. In many cases, losses topped $30–$35 billion in less than 90 days. The quicker prices move, the more panic reinforces volatility.
By contrast, private capital flows were comparatively steady. Illiquidity functioned as a buffer: without daily marks, long-term commitments held, and the forced-selling dynamics common in public markets were largely absent.
Liquidity provides short-term flexibility—but it also enables stampedes. Illiquidity, in turn, acts as a natural brake on reactive decision-making.
IV. Comparing Public vs. Private Markets: Volatility, Sensitivity, and Wealth Preservation
How Public and Private Markets React to Interest Rates

Interest-rate shifts transmit to asset prices almost instantly, and the effect is most visible in public equities. Because listed markets reprice continuously, changes in policy rates, real yields, or term premia flow directly into discount rates used by investors. Higher rates raise the hurdle for future cash flows, compressing price-to-earnings and EV/EBITDA multiples; lower rates do the opposite. This is the essence of “equity duration”: companies whose value is concentrated in far-out cash flows—typically high-growth or long-cycle businesses—are more sensitive to rate moves than firms with near-term, stable cash generation.
Mechanically, even small changes in the discount rate can produce outsized valuation effects via discounted cash flow math and the weighted average cost of capital (WACC). When the risk-free rate rises, WACC increases and the present value of distant earnings falls, leading to faster multiple compression in long-duration sectors (e.g., software, biotech) than in short-duration, cash-rich industries (e.g., staples, certain financials). The shape of the yield curve matters, too: a steepening led by the front end affects financing costs and working capital differently than a parallel shift, while increases in real yields (rather than inflation expectations) tend to weigh more heavily on equity valuations.
There are important second-order channels as well. Higher rates lift interest expense, reduce the attractiveness of debt-funded buybacks and M&A, and raise hurdle rates for capital projects—slowing investment and future growth. They also tighten credit conditions, widen equity risk premia when volatility rises, and influence currency moves that affect multinational earnings. Conversely, rate cuts typically ease these pressures, supporting multiple expansion and risk appetite. All of these forces operate with minimal delay in public markets, where continuous pricing translates policy changes into immediate mark-to-market moves.

Our regression analysis reveals:
NASDAQ Composite Index sensitivity to long-term rates is -0.4785
NASDAQ 100 Index is even more sensitive at -0.5706
PE Middle Market transactions, by contrast, exhibit a far milder sensitivity of -0.2307
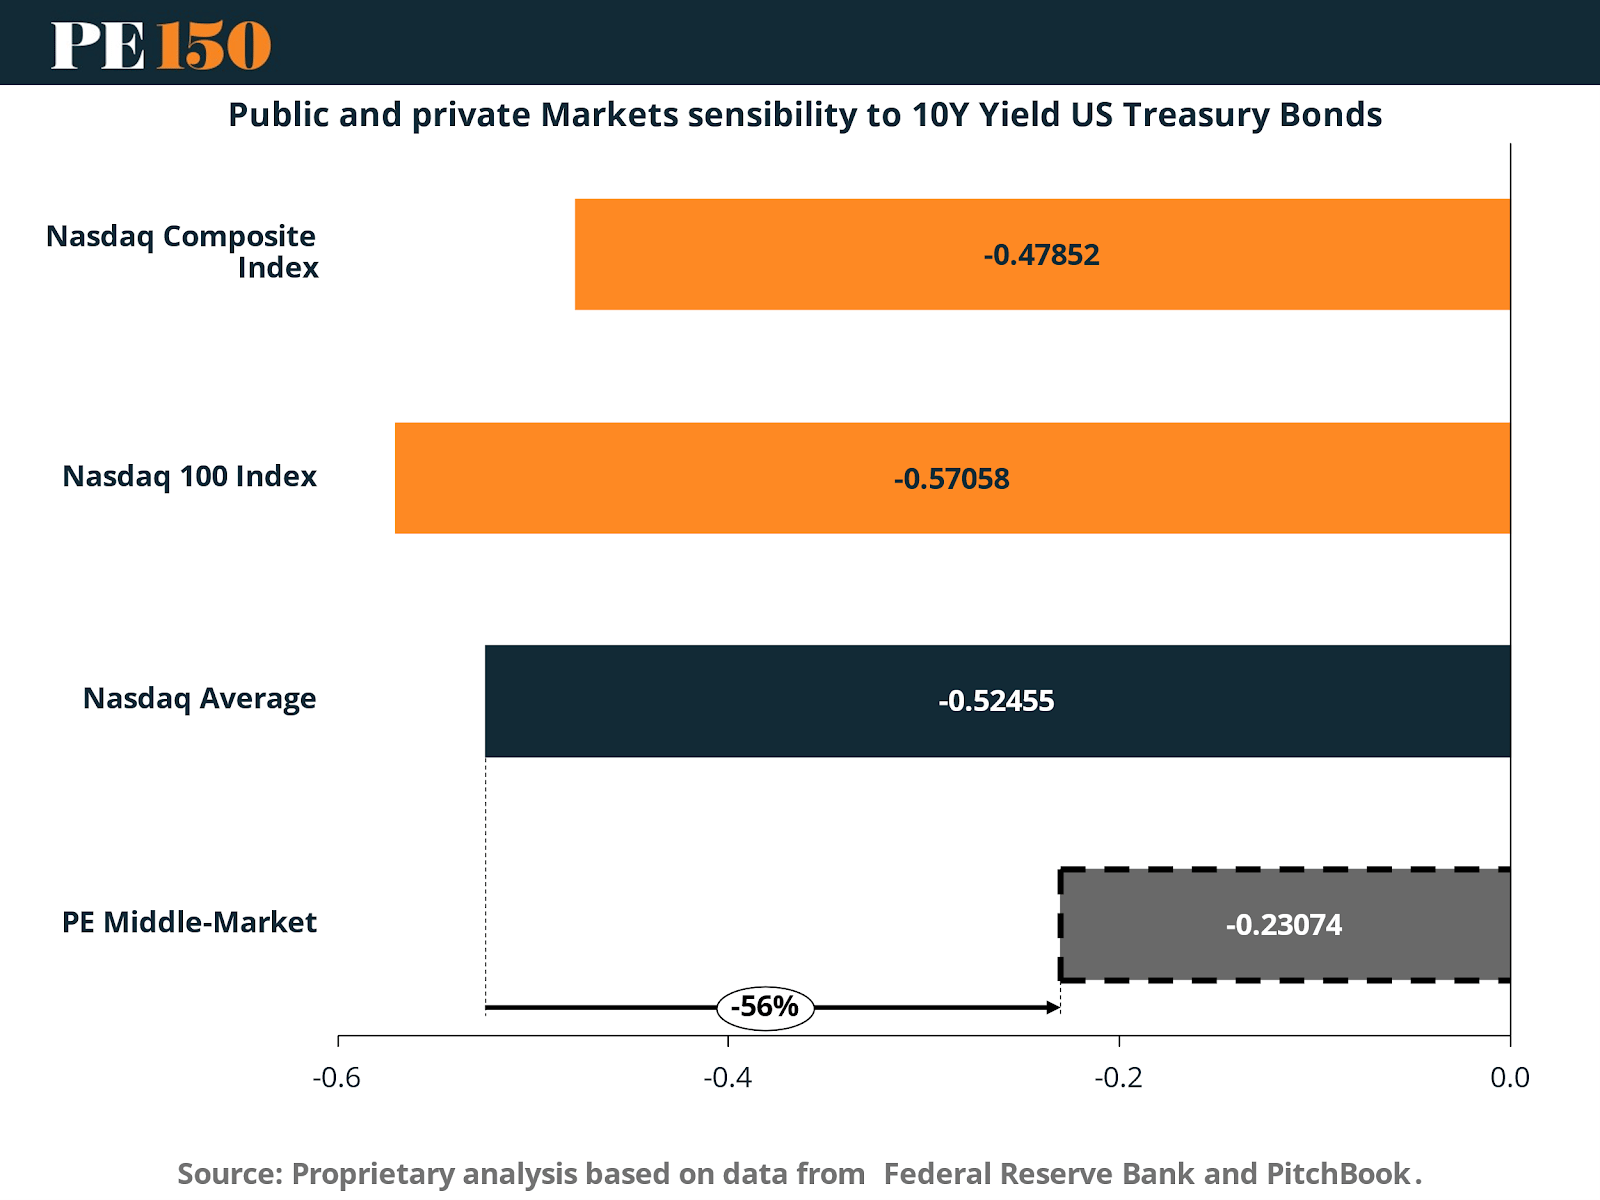
The scatterplots show that when yields climb, public markets reprice abruptly, while private deal values barely move. That buffer is structural: private equity runs on multi-year playbooks, negotiated pricing, and operational value creation—not sentiment-driven algorithms.
How Public and Private Markets Respond to Economic Uncertainty
Spikes in uncertainty act as live stress tests for the financial system. The way each asset class behaves in these moments shows how market structure shapes resilience.

This chart plots average annual standard deviation for public and private markets against Economic Uncertainty. The takeaway is clear—public indices (NASDAQ 100, NASDAQ Composite) see volatility surge as uncertainty rises, while private equity stays comparatively steady, shielding wealth from panic. Notably, PE middle-market and the MSCI PE series barely moved in 2020–2022 despite extreme uncertainty.

This long-horizon read of the Equity Market–Related Economic Uncertainty Index (2006–2024) applies a Hodrick–Prescott filter to isolate cyclical swings. Peaks in 2008, 2011, and 2020 align with sentiment-driven bull/bear phases in public equities that are weakly anchored in fundamentals. Each spike signals hesitation, policy ambiguity, and elevated volatility.
Public assets are pulled into these waves; private assets, with multi-year lockups, largely ride above them.

Periods of elevated economic uncertainty reliably coincide with higher market volatility, especially in public equities. This section traces how uncertainty shocks move through asset classes by comparing their annualized volatility responses to shifts in the Equity Market–Related Economic Uncertainty Index. The chart above shows the cyclical pattern of macro uncertainty from 2006 to 2024, with spikes aligning to major shocks—the 2008 global financial crisis, the 2011 debt-ceiling standoff, the 2018 trade war, and the 2020 COVID-19 pandemic.
These episodes mark the start of intense repricing and notable behavioral shifts across markets. Crucially, each upswing in the index reflects not only more volatility, but also wider forecast errors, greater investor caution, and sharper reallocations of capital—most visibly in liquid instruments.
1. Cumulative Returns Across Market Types

From a 2007 base of 100, the MSCI Total Developed Private Equity index reaches 2,970 by 2024—almost 3× the NASDAQ 100 (983) and roughly 11× the S&P 500 (267). The gap is the product of steady compounding, not market timing.
While public markets remain exposed to shock-driven drawdowns, private markets compound through lockups, multi-year playbooks, and patient capital.
Key insight from this analysis: Over long horizons, illiquidity turns from a constraint into an advantage: private equity’s insulated, programmatic value creation compounds far faster than public benchmarks that are continually whipsawed by volatility.
2. Annualized and Total Return Comparison

Private equity leads on both dimensions:
Total growth of 2,869.6% (MSCI PE) versus 882.5% (NASDAQ 100) and 267.5% (S&P 500)
CAGR of 22.1% versus 14.4% and 8.0%.
This edge reflects compensation for illiquidity, disciplined operational execution, and time-locked alignment—and it avoids daily mark-to-market noise.
3. Holding Periods Reveal the Secret

“Patience Is the Price of Admission”
Private equity is a long game (or an infinite one). Median holding periods in Europe are nearing 5.7 years in 2025, up from under 4.5 years in 2011. That additional runway makes it possible to:
Turn around underperforming businesses
Drive operational improvements and margin expansion
Optimize capital structure and governance
Choose exits based on conditions—not compulsion
If you can’t commit 5–7 years, you’re effectively opting out of private-market return engines. What some view as a disadvantage—time lockups—is, in practice, the gateway to alpha.
This horizon matches the J-curve: early years often show flat or negative marks as capital is deployed and fixes take hold; value realization typically arrives in years 4–7 through earnings growth, deleveraging, and multiple expansion at exit. The structure also limits redemption pressure, reducing forced selling, and—paired with vintage diversification—helps smooth entry points across cycles.
VI. Conclusion: Illiquidity Is Not a Bug. It’s the Feature.
For private-equity investors, the last two cycles reinforced a simple truth: structure drives outcomes. Public markets translate every macro feint—rate moves, policy uncertainty, headline risk—into immediate, often self-reinforcing volatility. Private markets, by design, do not. Multi-year commitments, negotiated entry points, and hands-on value creation mute mark-to-market noise and keep capital deployed while compounding works.
Across the evidence presented here, three patterns stand out. First, sensitivity to rates and uncertainty is materially lower in private transactions than in public benchmarks, reducing the odds that exogenous shocks force bad decisions. Second, volatility is not just higher in liquid markets; it is more behaviorally binding, inviting pro-cyclical selling exactly when patience is most valuable. Third, the return gap in favor of private equity is a compounding effect, not a timing trick—earned through operational improvement, governance, and disciplined exits chosen on conditions, not compulsion.
The Power of Illiquidity
What follows for allocators is practical, not theoretical:
Commit to programmatic pacing. Underwrite a 5–7+ year deployment across vintages to harness the J-curve and avoid cycle-timing errors.
Elevate value-creation plans. Focus underwriting on operational levers—margin expansion, pricing power, working-capital turns, and digital enablement—rather than multiple reliance.
Right-size liquidity buffers. Hold enough near-term liquidity at the portfolio level to ride through shocks without forced selling; keep capital calls investable through cycles.
Diversify by vintage, sector, and size. Middle-market complexity premiums and sector specialization can enhance alpha and reduce correlation to public proxies.
Use secondaries and co-investments selectively. Average into dislocations, lower fee drag, and sharpen control of exposure.
Be disciplined on leverage and covenants. Prefer resilient capital structures that preserve optionality when rates or spreads move against you.
The strategic takeaway is clear: treat illiquidity as a feature that converts volatility into time—time to execute, to improve businesses, and to exit on your terms. Investors who embrace this structure, pace consistently, and stay operationally oriented are positioned to protect wealth through uncertainty and compound it across cycles.
Sources & References
Baker, Scott R., Bloom, Nick and Davis, Steven J., Economic Policy Uncertainty Index for United States [USEPUINDXD], retrieved from FRED, Federal Reserve Bank of St. Louis; https://fred.stlouisfed.org/series/USEPUINDXD, August 27, 2025.
Baker, Scott R., Bloom, Nick and Davis, Stephen J., Equity Market-related Economic Uncertainty Index [WLEMUINDXD], retrieved from FRED, Federal Reserve Bank of St. Louis; https://fred.stlouisfed.org/series/WLEMUINDXD, June 4, 2025.
Board of Governors of the Federal Reserve System (US), Federal Funds Effective Rate [DFF], retrieved from FRED, Federal Reserve Bank of St. Louis; https://fred.stlouisfed.org/series/DFF, June 4, 2025.
Board of Governors of the Federal Reserve System (US), Market Yield on U.S. Treasury Securities at 10-Year Constant Maturity, Quoted on an Investment Basis [DGS10], retrieved from FRED, Federal Reserve Bank of St. Louis; https://fred.stlouisfed.org/series/DGS10, June 4, 2025.
MSCI. (2025). Tracking Private Equity. https://www.msci.com/downloads/web/msci-com/research-and-insights/paper/tracking-private-equity/Tracking%20Private%20Equity.pdf
NASDAQ OMX Group, NASDAQ 100 Index [NASDAQ100], retrieved from FRED, Federal Reserve Bank of St. Louis; https://fred.stlouisfed.org/series/NASDAQ100 June 4, 2025.
NASDAQ OMX Group, NASDAQ Composite Index [NASDAQCOM], retrieved from FRED, Federal Reserve Bank of St. Louis; https://fred.stlouisfed.org/series/NASDAQCOM, June 4, 2025.
PE150. (2025). Moody’s Downgrades U.S. Credit Rating Over Fiscal Risk and Inflation. https://www.pe150.com/p/moody-s-downgrades-u-s-credit-rating-amid-rising-fiscal-concerns-1830
PE150. (2025). M2 Infinity and Beyond. https://www.pe150.com/p/m2-infinity-and-beyond-99c8
PE150. (2024). The Infinite Game of Private Equity: A Game Theory Perspective. https://www.pe150.com/p/the-infinite-game-of-private-equity-a-game-theory-perspective-652e
PE150. (2025). The State of Private Equity Middle-Market in US. https://www.pe150.com/p/the-state-of-private-equity-middle-market-in-us
Pitchbook. (2024). US PE Middle Market Report. https://files.pitchbook.com/website/files/pdf/2024_Annual_US_PE_Middle_Market_Report.pdf
Premium Perks
Since you are an Executive Subscriber, you get access to all the full length reports our research team makes every week. Interested in learning all the hard data behind the article? If so, this report is just for you.
|
