- PE 150
- Posts
- Housing at the Core: Inflation Persistence, Asset Repricing, and the Political Economy of Institutional Ownership
Housing at the Core: Inflation Persistence, Asset Repricing, and the Political Economy of Institutional Ownership
Gaston Brizuela Bosio
February 13, 2026 • Estimated Reading Time: 5 minutes

At the macroeconomic level, the U.S. cost-of-living crisis is not a story of runaway inflation in the abstract. Headline CPI has stabilized at 2.7% year over year as of December 2025. From a policy standpoint, this suggests partial success in post-pandemic disinflation. Yet the lived experience of households diverges materially from the aggregate narrative.
The CPI level index shows a step-change beginning in 2021, with prices moving from a gradual 2010–2019 trajectory to a sharper incline through 2022 and remaining elevated thereafter. Inflation, once embedded, operates asymmetrically: it accelerates rapidly but decelerates slowly. While the rate of change moderates, the level remains permanently higher. That distinction—between inflation and the price level—is central to understanding today’s cost-of-living pressures.
Disinflation is not deflation. A slowdown in inflation does not restore purchasing power lost in prior years. It simply stabilizes the new, higher plateau.

Monthly data reinforces the persistence narrative. December 2025 recorded a 0.3% month-over-month increase, following a sequence of modest but steady gains. Food prices rose 0.7% in a single month. Utility gas service surged 4.4% month over month and over 10% year over year. These are non-discretionary expenditures; households cannot substitute away from heat, shelter, or groceries.
Inflation concentrates in essentials before diffusing into discretionary categories. That concentration explains why households report elevated financial stress even when headline figures appear manageable. CPI stability at 2–3% masks heterogeneity in category behavior.

Housing’s structural dominance is mathematical, not rhetorical. At 44.2% of the CPI basket, housing—primarily shelter—overwhelms all other categories. Transportation (16.6%) and food (14.5%) follow at considerable distance.
Because of this weighting, inflation is largely a housing story. If shelter inflation runs persistently above the headline rate, aggregate inflation cannot sustainably decline without it. Monetary policy can dampen goods prices relatively quickly through demand compression. Shelter, by contrast, reprices slowly and exhibits downward rigidity. Lease contracts reset gradually; vacancy rates adjust with lags; construction supply responds sluggishly to interest rate signals.
Inflation, therefore, is path dependent when housing is the anchor.

The December 2025 breakdown makes the persistence explicit. Shelter rose 0.4% month over month and 3.2% year over year—above headline CPI. Core services inflation remains firm. Energy commodities declined, and apparel inflation remained muted, yet shelter continued to exert upward pressure.
This divergence matters because services inflation, and especially shelter, is driven less by transitory supply shocks and more by structural constraints: zoning restrictions, land scarcity, construction costs, demographic demand, and replacement values.
Unlike goods, housing prices do not correct through discount cycles. They reset upward and stabilize. The slow-moving nature of housing costs renders inflation “sticky” even when goods prices soften.

From a household perspective, the burden is immediate. Housing absorbs 33% of expenditures, followed by transportation (17%) and food (13%). Combined, these three categories account for over 60% of a typical budget.
Thus, even modest percentage increases in shelter translate into disproportionate strain. A 3% increase in rent has greater welfare implications than a 10% decline in electronics prices. Inflation in essentials reduces discretionary margin, compresses savings rates, and exacerbates inequality between homeowners—who may experience asset appreciation—and renters, who face pure cost escalation.
The distributional effects are pronounced. Homeowners benefit from nominal asset repricing. Renters absorb cost increases without balance sheet gains.

The long-term trajectory of the House Price Index illustrates how housing operates inside the inflation system rather than reacting to it externally. Over the past decade, U.S. house prices increased approximately 101%.
This appreciation transcended multiple regimes: ultra-low rates, pandemic stimulus, aggressive tightening, and subsequent normalization. Housing prices respond less to short-term inflation spikes and more to structural supply constraints and nominal income growth.
Critically, housing prices compound on prior levels. Even if appreciation moderates, the price base remains elevated. This compounds affordability constraints because down payments, mortgage qualification thresholds, and debt-to-income ratios scale with nominal price levels.
The result is a widening affordability gap for first-time buyers.
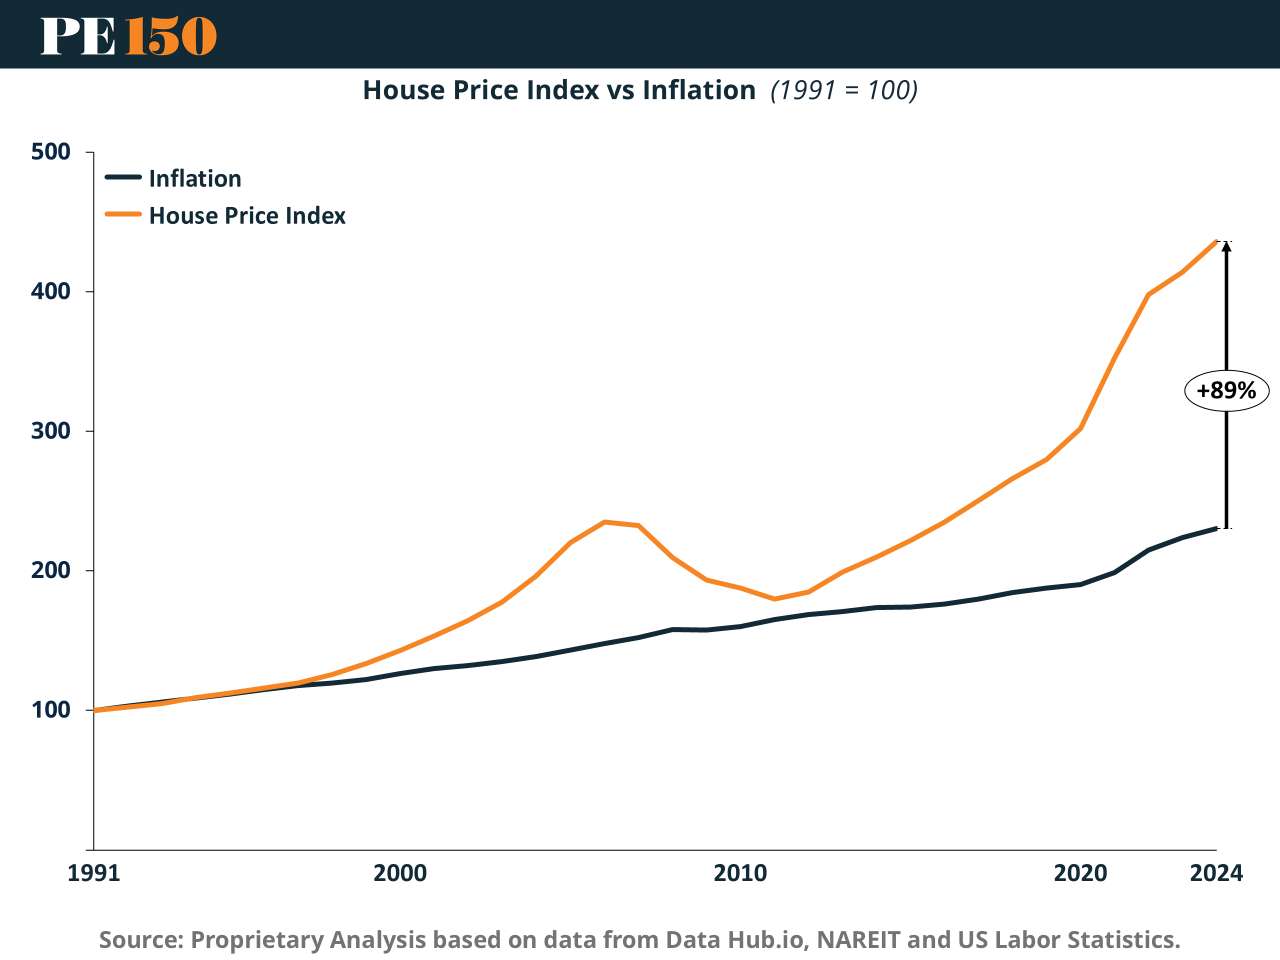
Over the long horizon since 1991, housing prices have outpaced inflation by approximately 89%. Housing has functioned as a real asset hedge—preserving and enhancing purchasing power relative to general price levels.
For institutional capital, this characteristic is central. Housing offers:
Embedded inflation protection (shelter is in CPI).
Inelastic supply in key markets.
Recurring rental income indexed to wage growth.
Tangible collateral with financing optionality.
From a portfolio construction standpoint, single-family rental housing resembles a quasi-utility asset with inflation pass-through characteristics. That profile explains the rise of institutional participation in residential markets following the 2008 foreclosure wave.
Institutional Ownership and Market Power
The political economy question emerges naturally: does institutional concentration exacerbate affordability pressures?
Institutional investors are estimated to own between 0.5% and 4% of the single-family housing market, depending on definitions. While nationally modest, ownership is regionally concentrated in high-growth Sun Belt markets. In localized submarkets, institutional share can be materially higher.
Critics argue that large investors:
Outbid first-time buyers using scale and cash.
Convert owner-occupied inventory into rental portfolios.
Leverage data analytics to optimize rent increases.
Potentially exert localized pricing power.
President Trump’s executive action seeks to restrict large institutional purchases of single-family homes, directing federal agencies to limit program support for such acquisitions and encouraging “first-look” policies for owner-occupants. The stated objective is to prevent Wall Street from competing with Main Street.
Markets reacted immediately: shares of major real estate investment firms declined. The signaling effect suggests perceived policy risk to institutional models reliant on acquisition pipelines.
Yet the macroeconomic impact of a ban remains uncertain. If institutional buyers represent a small share nationally, removing them may not materially expand supply. Moreover, capital is fungible. Restrictions on large investors may shift activity to mid-sized operators rather than directly to first-time households.
Daryl Fairweather of Redfin has noted that excluding large players does not guarantee owner-occupant substitution. Supply constraints—zoning, land use, construction bottlenecks—remain binding.
From an economic perspective, affordability is primarily a supply problem interacting with income growth and credit conditions. Institutional demand may amplify local pressures, but it does not originate structural scarcity.
Macro Synthesis
The cost-of-living crisis is fundamentally a housing crisis because housing dominates both inflation measurement and household expenditure. Shelter inflation persists due to slow repricing dynamics and structural supply rigidity. House prices have doubled over the past decade, materially outpacing inflation.
Institutional investors operate rationally within this system. Housing offers durable inflation protection and yield stability. Their participation reflects asset allocation logic rather than macroeconomic distortion per se.
However, political scrutiny intensifies when asset class characteristics intersect with social equity concerns. Homeownership remains the principal vehicle of middle-class wealth accumulation. When entry barriers rise—via price appreciation, interest rates, or competitive bidding—the legitimacy of capital concentration is questioned.
Banning institutional ownership may be politically resonant but economically partial. Without addressing land-use constraints, construction productivity, and demographic demand, price pressures are unlikely to abate materially.
In macroeconomic terms, the U.S. faces a structural imbalance: a housing supply function that is insufficiently elastic relative to income growth and capital flows. Inflation has receded at the headline level, but its housing core remains embedded.
Until shelter dynamics normalize—through supply expansion rather than demand suppression—the cost-of-living crisis will persist. And as long as housing continues to outperform inflation, institutional capital will seek exposure.
The intersection of inflation persistence, asset appreciation, and political intervention defines the current housing cycle. The economic debate is not merely about who owns homes—but about whether the system can generate enough of them.
Sources & References
BBC. (2026). Trump backs ban on institutional investor home purchases. https://www.bbc.com/news/articles/c0lxz5wn2yzo
Bureau of Labor Statistics. (2026). CONSUMER PRICE INDEX – DECEMBER 2025. https://www.bls.gov/news.release/pdf/cpi.pdf
CNBC. (2026). Here’s the inflation breakdown for December 2025 — in one chart. https://www.cnbc.com/2026/01/13/cpi-inflation-december-2025-breakdown.html
NAREIT. Monthly Index Values & Returns. https://www.reit.com/data-research/reit-indexes/monthly-index-values-returns
Statista. (2025). The Components of the Consumer Price Index. https://www.statista.com/chart/31266/composition-of-the-consumer-price-index/?srsltid=AfmBOooHT6B0_OYOl7YzJ7nxdsdRA98IheDRB_bnffsvXqbkJnyeGPhC
The White House. (2026). Fact Sheet: President Donald J. Trump Stops Wall Street from Competing with Main Street Homebuyers. https://www.whitehouse.gov/fact-sheets/2026/01/fact-sheet-president-donald-j-trump-stops-wall-street-from-competing-with-main-street-homebuyers/
U.S. Bureau of Labor Statistics, Consumer Price Index for All Urban Consumers: All Items in U.S. City Average [CPIAUCSL], retrieved from FRED, Federal Reserve Bank of St. Louis; https://fred.stlouisfed.org/series/CPIAUCSL, January 29, 2026.
U.S. Federal Housing. (2026). FHFA House Price Index Datasets. https://www.fhfa.gov/data/hpi/datasets